Talk to a computer vision expert
How to use FiftyOne’s native support for COCO to power your workflows

The COCO dataset has been one of the most popular and influential computer vision datasets since its release in 2014. It serves as a popular benchmark dataset for various areas of machine learning, including object detection, segmentation, keypoint detection, and more. Chances are that your favorite object detection architecture has pre-trained weights available from the COCO dataset.
This post describes how to use FiftyOne to visualize and facilitate access to COCO dataset resources and evaluation. With FiftyOne, you can download specific subsets of COCO, visualize the data and labels, and evaluate your models on COCO more easily and in fewer lines of code than ever.
Setup
Using FiftyOne to access and work with the COCO dataset is as simple as installing the open-source Python package:
Downloading COCO
While existing tools or your own custom scripts have likely enabled you to download COCO splits in the past, have you ever wished you could download a small sample of a dataset for higher fidelity analysis before scaling up to the full dataset?
The FiftyOne Dataset Zoo now supports partially downloading and loading COCO directly into Python in just one command. For example, say you are working on a road scene detection task and you are only interested in samples containing vehicles, people, and traffic lights. The following code snippet will download 100 of just the relevant samples and load them into FiftyOne:
The command to load COCO takes the following arguments allowing you to customize exactly the samples and labels that you are interested in:
label_types: a list of types of labels to load. Values are("detections", "segmentations"). By default, all labels are loaded but not every sample will include each label type. Ifmax_samplesandlabel_typesare both specified, then every sample will include the specified label types.splitandsplits: either a string or list of strings dictating the splits to load. Available splits are("test", "train", "validation").classes: a list of strings specifying required classes to load. Only samples containing at least one instance of a specified class will be downloaded.max_samples: a maximum number of samples to import. By default, all samples are imported.shuffle: boolean dictating whether to randomly shuffle the order in which the samples are imported.seed: a random seed to use when shuffling.image_ids: a list of specific image IDs to load or a filepath to a file containing that list. The IDs can be specified either as<split>/<image-id>or<image-id>
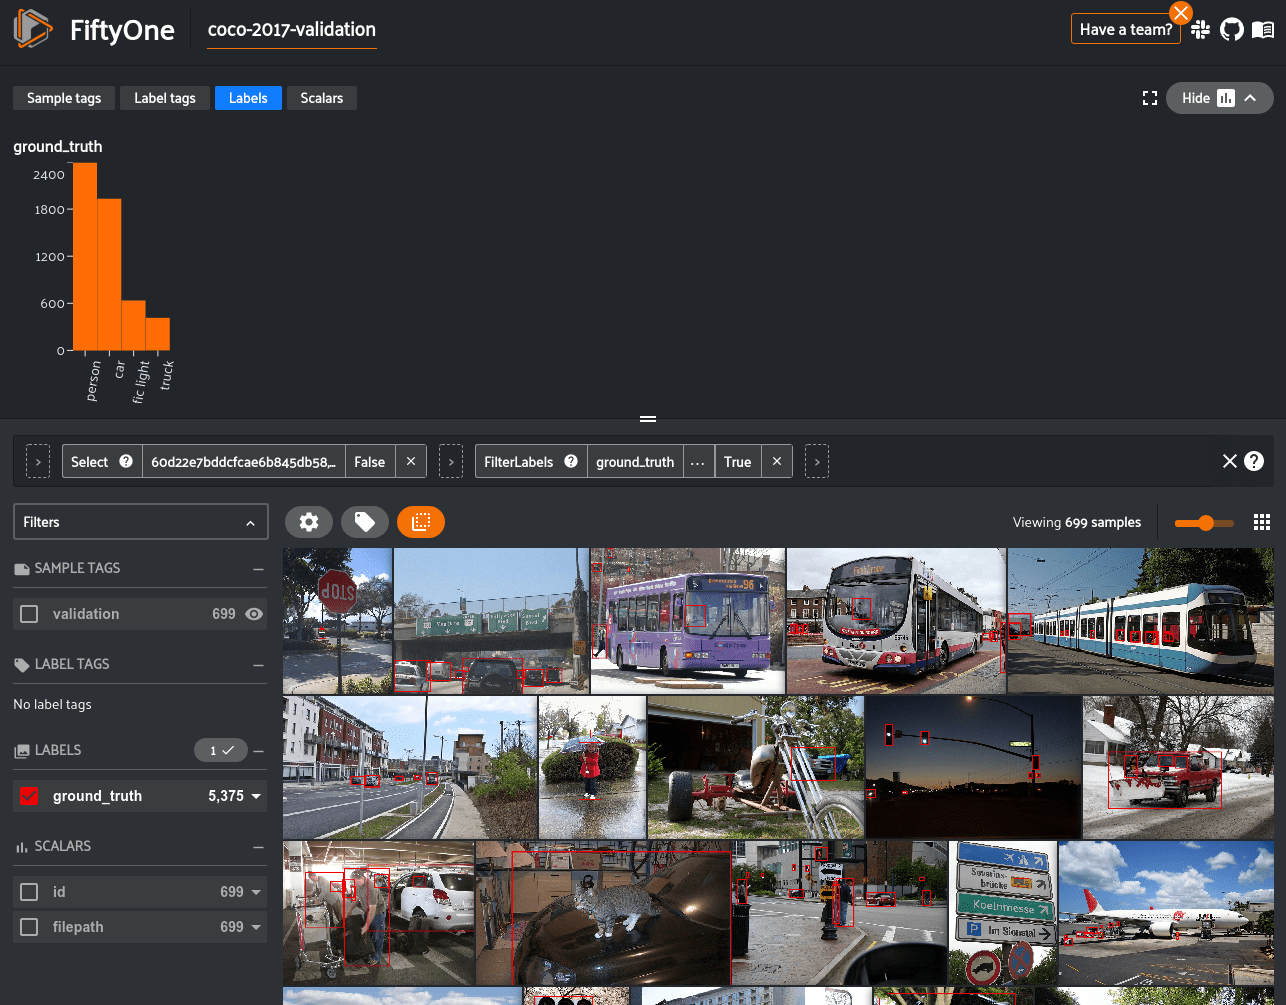
Visualizing the dataset
Most ML engineers have integrated basic support for viewing small batches of images into their workflows, eg levering tools like Tensorboard, but such workflows do not allow for dynamically searching your dataset for specific examples of interest. This is an important gap to address because the best way to understand the failure modes of your model is to investigate the quality of a dataset and annotations is to visualize them and scroll through some examples.
The FiftyOne App allows everyone to visualize their datasets and labels without needing to spend time and money writing their own scripts or tools for visualization. When combined with the ease of use of the FiftyOne API, it now only takes a few lines of code to get hands-on with your data.

FiftyOne also provides a powerful query language allowing you to create custom views into your dataset to answer any question you have about your data. For example, you can create a view that filters predictions of a model by confidence and sorting so that samples with the most number of ground truth objects first.
Evaluating models

The COCO API has been widely adopted as the standard metric for evaluating object detections. The COCO average precision is used to compare models in nearly every object detection research paper in the last half-decade. While it’s very useful to have a single metric that can be used to compare models at a high level, in practice, there is more work that needs to be done.
When developing a model that will be put to use in a real-world scenario, you need to build confidence in the model performance in a variety of situations. A single metric will not give you that information, the only way to understand exactly where your model performs well and where it performs poorly is to look at individual samples and even individual predictions to find success and failure cases.
FiftyOne provides extensive evaluation capabilities for various tasks, but most notably, it lets you take the next step after computing COCO AP and dig into the predictions of your models. You can add your own model predictions to a FiftyOne dataset with ease.
The example below shows how you can use FiftyOne’s
evaluate_detections() method to evaluate the predictions of a model from the FiftyOne Model Zoo.Then you can use the FiftyOne App to analyze individual TP/FP/FN examples and cross-reference with additional attributes like whether the annotation is a crowd.

Once you have evaluated your model in FiftyOne, you can use the returned
resultsobject to view the AP, plot precision-recall curves, and interact with confusion matrices to quickly find the exact samples where your model is correct and incorrect for each class.
Note: Interactive plots are currently only available in Jupyter notebooks but other contexts will be supported soon!
Summary
COCO is one of the most popular and influential computer vision datasets. Now, FiftyOne’s native support for COCO makes it easier than ever to download specific parts of the dataset, visualize COCO and your model predictions, and evaluate your models with COCO-style evaluation.
Loading related posts...
© 2026 Voxel51 All Rights Reserved


