How to visualize point clouds, create orthographic projections, and evaluate detections with the latest release of FiftyOne
3D perception in computer vision enables computers and machines to understand the depth and structure of the 3D world around us, just as we do. Work in this field is exciting, with limitless potential for applications to revolutionize the way we live and work across all industries, from automotive to virtual reality.
At the heart of 3D imaging applications, point clouds are used to efficiently represent three-dimensional spatial data. That’s why recent years have seen a flood of algorithms for processing, understanding, and making predictions using point clouds. These point clouds can be generated via either laser scanning techniques, such as lidar, or photogrammetry, or even via generative techniques, such as OpenAI’s recently released Point-E.
The latest release of the FiftyOne computer vision toolset, 0.20, includes enhanced point cloud support to deliver unprecedented access to and control over your 3D data.
FiftyOne 0.20 ships with the following 3D functionality:
- Orthographic projections, including bird’s eye view (BEV)
- Support for point cloud-only datasets in the FiftyOne App
- Multiple point cloud slices in grouped datasets
- Enhanced rendering and customization
- Support for evaluating 3D object detection predictions
These features add to FiftyOne’s existing 3D capabilities for working with and visualizing point clouds.
Read on and learn how to harness FiftyOne to inspect, explore, and interact with your 3D data!
Preview 3D data with orthographic projections
Do you ever have a bunch of 3D samples that you want to rapidly peruse? Perhaps you want a bird’s eye view (BEV) of autonomous driving scenes from the KITTI Vision Benchmark Suite, nuScenes, or Waymo Open Dataset? Or perhaps you’re working with a dataset of indoor scenes such as the Stanford Large-Scale 3D Indoor Spaces Dataset, and you want an elevation view into the scene.
Our new 3D utils integrate this functionality into the FiftyOne library and the FiftyOne App via the compute_orthographic_projection_images() method.
import fiftyone as fo
import fiftyone.zoo as foz
import fiftyone.utils.utils3d as fou3d

dataset = foz.load_zoo_dataset("quickstart-groups")

min_bound = (0, -15, -2.73)
max_bound = (20, 15, 1.27)
size = (608, -1)

fou3d.compute_orthographic_projection_images(
    dataset,
    size,
    "bev_images",
    shading_mode="height",
    bounds=(min_bound, max_bound)
)

session = fo.launch_app(dataset)
By default, this method generates bird’s eye view projections of your point clouds, which then show up in the FiftyOne App as previews of point cloud samples (with filterable projections of polylines and bounding boxes as well). Also note that we’ve passed in bounds, telling FiftyOne where to crop the generated images, as well as a shading_mode, specifying that the point cloud’s intensity should be used to color the projection (as opposed to the height values, or colors of the individual points).
If you’d like, you can also pass in a normal vector to specify the plane with respect to which the routine should perform the projection, for instance, try projection_normal=(0.5, 0.5, 0.)!
Inside of the 3D visualizer, you can also control a variety of characteristics of the look and feel, including setting point size and turning grid lines on or off.
Group point cloud slices
In FiftyOne, grouped datasets allow you to combine samples – potentially with varied media types (image, video, and point cloud) – in groups, with samples occupying different slices. New in this release, FiftyOne has revamped grouped datasets so that groups can have multiple point cloud samples.
This can come in handy in a variety of scenarios, including:
- Multiple point clouds for the same scene, coming from different sensors
- Examining the effect of subsampling point clouds with millions of points
- Transforming point clouds by rotation or scaling operations
- Coloring points by cluster index or semantic segmentation label
Let’s see this in action, clustering our point clouds with DBSCAN. We’ll create a new group slice, and add a new sample to each group in the pcd_cluster group slice. See this gist for the corresponding code.
Then we compute the orthographic projection images for these new point clouds – but this time, we pass in shading_mode=rgb, because we’ve used the point cloud’s RGB channels to encode cluster numbers. We’ll also use slightly different bounds, so it is easier to see the clusters.
min_bound = (0, -10, -2.73)
max_bound = (20, 10, 1.27)

fou3d.compute_orthographic_projection_images(
    dataset,
    size,
    "/tmp/bev_cluster_images",
    in_group_slice="pcd_cluster",
    shading_mode="rgb",
    bounds=(min_bound, max_bound)
)
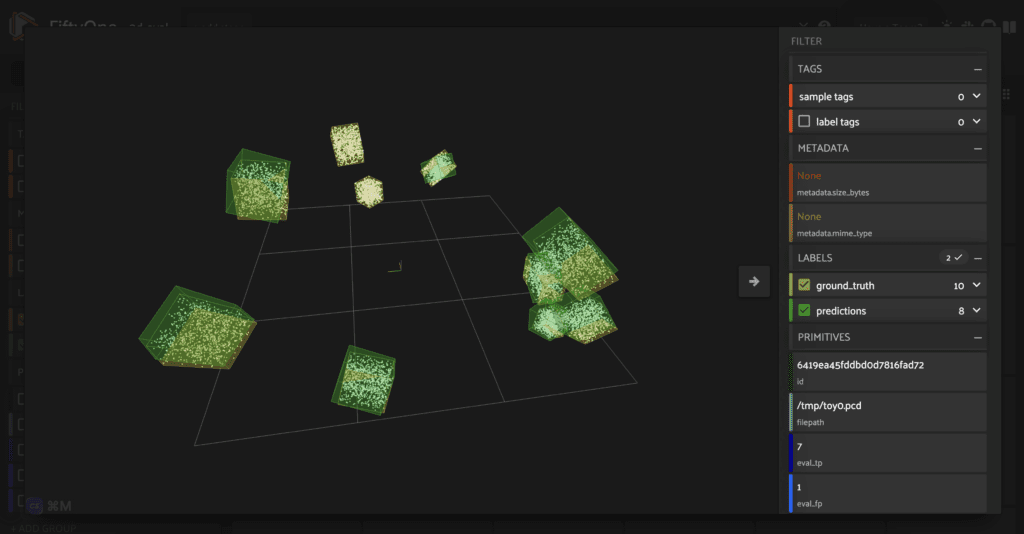
Evaluate 3D object detections
If you’re familiar with FiftyOne’s Evaluation API, you’ll know that the evaluate_detections() already supported the 2D object detection bounding boxes in image and video datasets. Today’s release extends these capabilities to 3D bounding boxes, with arbitrary rotation angles.
FiftyOne automatically recognizes when the bounding box is three dimensional, and applies the appropriate method to compute 3D intersection over union (IoU) scores, which are used to determine whether a prediction agrees with a ground truth object.
As an example, here is some sample code to generate a point cloud only dataset with 50 samples, and 10 ground truth bounding boxes per sample. To generate predictions, we randomly perturb some of the ground truth bounding boxes, and omit others from our predicted detections. The code can be found in this gist.
We can then evaluate our detection predictions with evaluate_detections():
results = dataset.evaluate_detections(
    "predictions",
    eval_key="eval"
)
And print out a report on dataset-level evaluation metrics:
results.print_report()
             precision    recall  f1-score   support

         dog       0.83      0.66      0.74       500

   micro avg       0.83      0.66      0.74       500
   macro avg       0.83      0.66      0.74       500
weighted avg       0.83      0.66      0.74       500
As with 2D detection evaluations, you can specify what IoU threshold to use during evaluation by passing in the iou argument:
results_high_iou = dataset.evaluate_detections(
    "predictions",
    iou=0.75
)

results_high_iou.print_report()
             precision    recall  f1-score   support

         dog       0.12      0.09      0.10       500

   micro avg       0.12      0.09      0.10       500
   macro avg       0.12      0.09      0.10       500
weighted avg       0.12      0.09      0.10       500
Once you have evaluated your object detection predictions, you can also isolate evaluation patches containing, for instance, false positive predictions:
eval_patches = dataset.to_evaluation_patches("eval")
fp_patches = eval_patches.match(F("type") == "fp")
You can then sort by prediction confidence to identify your highest confidence false positive predictions:
high_conf_fp_view = fp_patches.sort_by("predictions.confidence")
Create point cloud-only datasets
Previously, FiftyOne supported point clouds in a grouped dataset along with other media. However, point clouds are first class citizens. As such, the FiftyOne App now supports point cloud only datasets!
One situation in which this might be useful, for instance, is if you’re generating point clouds from scratch. Let’s see this with an example, using OpenAI’s Point-E to turn text prompts into three dimensional point cloud models.
We use the sampler from the Point-E text2pointcloud example notebook, and convert the resulting point clouds using Open3d.
def generate_pcd_from_text(prompt):
    samples = None
    for x in sampler.sample_batch_progressive(
        batch_size=1,
        model_kwargs=dict(texts=[prompt])
    ):

    samples = x

    pointe_pcd = sampler.output_to_point_clouds(samples)[0]
    channels = pointe_pcd.channels
    r, g, b = channels["R"], channels["G"], channels["B"]
    colors = np.vstack((r, g, b)).T
    points = pointe_pcd.coords

    pcd = o3d.geometry.PointCloud()
    pcd.points = o3d.utility.Vector3dVector(points)
    pcd.colors = o3d.utility.Vector3dVector(colors)
    return pcd
Then we generate an example dataset in FiftyOne, assigning each point cloud a random filename:
def generate_random_filename():
    rand_str = str(uuid.uuid1()).split('-')[0]
    return "pointe_vehicles/" + rand_str + ".pcd"

def generate_dataset(num_samples = 100):
    vehicles = ["car", "bus", "bike", "motorcycle"]
    colors = ["red", "blue", "green", "yellow", "white"]

    samples = []
    for i in tqdm(range(num_samples)):
        vehicle = random.choice(vehicles)
        cols = random.choices(colors, k=2)
        prompt = f"a {cols[0]} {vehicle} with {cols[1]} wheels"
        pcd = generate_pcd_from_text(prompt)
        ofile = generate_random_filename()
        o3d.io.write_point_cloud(ofile, pcd)

        sample = fo.Sample(
            filepath = ofile,
            tags = cols,
            vehicle_type = fo.Classification(label = vehicle)
        )
        samples.append(sample)

    dataset = fo.Dataset("point-e-vehicles")
    dataset.add_samples(samples)
    return dataset
All that is left to do is compute the orthographic projections. Here we will use a non-default projection_normal so that our preview image is not a bird’s eye view:
import fiftyone.utils.utils3d as fou3d
fou3d.compute_orthographic_projection_images(
    dataset,
    (-1, 608),
    "/tmp/side_images",
    shading_mode="rgb",
    projection_normal = (0, -1, 0)
)
(3D point cloud) synthesis
If you aren’t working with your 3D point clouds in FiftyOne, you’re missing out. Visualize your point clouds in the same place that you visualize your images, videos, geo data, and more.
Dive deeper and learn how to use Point-E point cloud synthesis with FiftyOne to generate your own 3D self-driving dataset!
Join the FiftyOne community!
Join the thousands of engineers and data scientists already using FiftyOne to solve some of the most challenging problems in computer vision today!
- 1,400+ FiftyOne Slack members
- 2,700+ stars on GitHub
- 3,500+ Meetup members
- Used by 258+ repositories
- 58+ contributors

