Understand your data better with unsupervised clustering
Bringing structure to vision datasets can be a painful experience. Hundreds of thousands of images without any annotations or metadata to go off is a daily occurrence for many machine learning engineers. You could spend time manually scraping through the images to categorize them, or you can level up your computer vision workflow by using the newest FiftyOne Plugin, Interactive Clustering!
Clustering in machine learning, particularly in the domain of computer vision, is a technique used to group similar samples together based on certain features or characteristics. The goal of clustering is to partition the dataset into more distinct groups such that the data points in any given cluster are more similar to each other than they are to data points in other clusters.
Clustering serves as a great tool for pre labeling your dataset, understanding more about the landscape and density of your data, as well helping support baselines assumptions, such as the number of distinct classes within your dataset. Today, I will show how you can quickly add some of the best clustering algorithms to your computer vision workflow, all within FiftyOne’s App!
Installation
We can start by first installing FiftyOne and our plugin to our environment. Both can be done in your terminal with the following:
pip install fiftyone
fiftyone plugins download https://github.com/danielgural/clustering_algorithms
We can verify the installation of our new plugin with the command:
fiftyone plugins list
Execution
Once installed, we can kick open the FiftyOne app with the dataset of our choice. If you need help loading your dataset, check out the documentation on how to get started. We will be using the KITTI test split for our example. We can get started with:
import fiftyone as fo
import fiftyone.zoo as foz


dataset = foz.load_zoo_dataset("kitti", split="test")

session = fo.launch_app(dataset)
Once you are in the app, hit the backtick key ( ` ) or the browse operations button to open the operators list. Look for the `cluster_samples` operator and you will be met with the input menu. Feel free to browse all the different clustering options!
All the clustering algorithms are sourced from the sklearn library. The eight currently support algorithms are:
To learn more about each of them, I highly recommend checking out the sklearn documentation about them. All the inputs, descriptions, and default values in the plugin are as given by the docs as well. Be sure to try several to see which works the best, as certain algorithms are more sensitive to features in your data such as noise and outliers, scale, feature representation in the images and cluster shapes. Let’s see the clustering in action!
KITTI Dataset with K-Means Clustering
After running a standard K-Means clustering algorithm on the test set of KITTI, we are able to determine some interesting clusters within our dataset. I set the number of clusters to 6 for this run, as my main objective is to find any clusters I may need to be particularly worried about for training. Within these clusters, unbeknownst to me, there could be hidden biases or image issues, such as recurring features, different lighting conditions or time of day, or different camera angles or lenses. Any of these occurrences could prove a nuisance for me down the road as models get deployed or model accuracy plateaus.
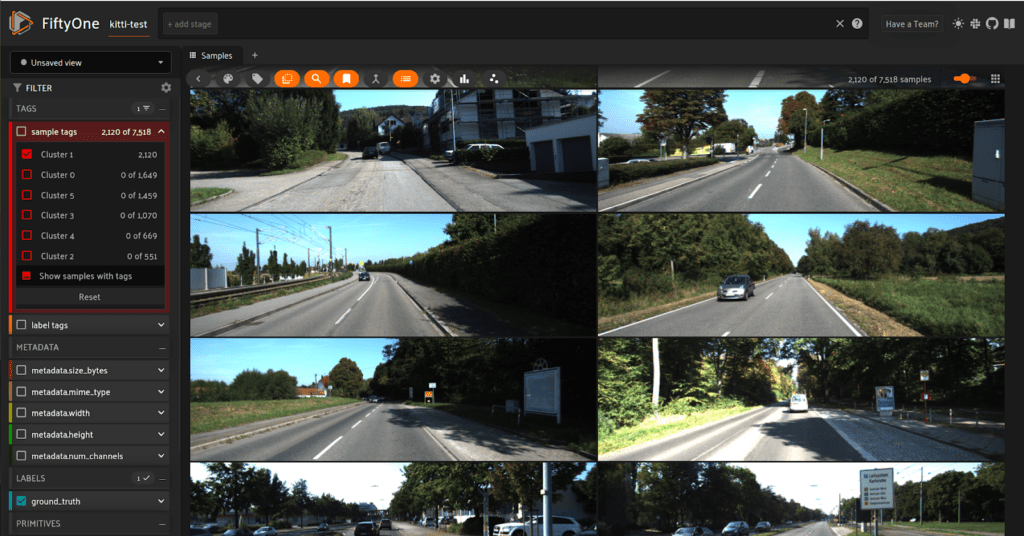
Clustering leads to some interesting results! Above we can see in cluster 1, more rural driving than the other samples. It is interesting to see what groups the algorithm breaks our dataset into and also the sizes of these clusters. Cluster 1 is the largest of all the clusters and is made up of the most generic, rural/suburban driving with not many unexpected colors, weather, shadows, or any other unexpected conditions.
Another interesting case is Cluster 2. As we begin to scroll through this cluster, an uncomfortable pattern begins to form
We are seeing this blue building A LOT. Way too often for an ADAS training set especially. It is important in datasets like driving ones to makre sure we are not overfitting on certain backgrounds. If pictures were taken in the same parking and make up 10% of the dataset, that would be an issue! Unlike Cluster 1 which was formed around features of the road that was being driven, Cluster 2 is just … blue. This serves as a great example that even in the best of datasets, using clustering algorithms can help find troublesome patterns or relationships. Now our model runs the risk of learning features not because of their relationship in respect to driving, but because of the pattern of colors or buildings that were present in the training set.
Using Clustering for Pre-Labeling
One of the other most prevalent uses for clustering is to help pre-label for classes. Pre-labeling is a common workflow when first exploring new unlabeled data. The idea is that it is much easier and quicker to go through the samples and QA poorly labeled samples than label all samples in the dataset. As an example for this, we will use the MNIST dataset as a classic example. The dataset consists of drawings of numbers 0-9 and we will be using the BIRCH clustering algorithm to see how well the samples can be clustered into their respective clusters. We set the number of clusters to 10 and run the plugin to find out!
Overall the results are pretty outstanding! Most classes only have about a 1-5% error rate within their cluster, putting almost all the right classes together. Of course there are still mistakes, but most importantly, each cluster is a well defined class. This can be the first step to creating a high quality annotated dataset!
Now it is important to note that to successfully cluster your samples, it is important to be familiar with your data. Things like selecting the number of clusters is a great example of being familiar with what you are looking for. As with any automated labeling flow, it is important to QA your samples afterwards to double check expected results!
Conclusion
Clustering is one of the best tools for data exploration today. Finding meaningful clusters, especially across hundreds of thousands if not millions of samples can be a daunting task, but with FiftyOne, the workflow can be made simple with the Clustering Algorithms Plugins. If you are interested in finding more FiftyOne plugins, checkout our community repo to optimize your workflows with plugins or contribute one of your own! Plugins are highly flexible and always open source so that you can customize it exactly to your needs! Have fun exploring!

