Featured Resource

Featured Case Study
AI Data Modeling for Visual AI: Key Metrics to Build Precise Models
Modern artificial intelligence (AI) applications rely on increasingly complex data – often vast amounts of data generated by sensors, cameras, and user interactions – to power tasks like image classification, object detection, and semantic segmentation. Yet collecting and labeling large volumes of raw data is only the beginning. To fully harness the capabilities of neural networks and deep learning, an effective data modeling process is essential. This means going beyond simple annotation to carefully structure input data, measure relevant metrics, and iteratively refine predictive models. In this article, we’ll delve into AI data modeling for visual AI, explore key metrics for evaluating data models, and showcase how tools like FiftyOne can be used to drive iterative improvements.
The Importance of AI Data Modeling in Visual AI
Data modeling, the process of structuring, organizing, and preparing data for training and evaluating AI models is central to developing accurate visual AI systems, such as object detection or semantic segmentation networks, directly influencing how effectively insights can be extracted from diverse data types like images, videos, and associated metadata. It extends beyond merely labeling input-output variables, requiring a deep understanding of data structures, distributions, biases, class imbalances, labeling inconsistencies, and critical success metrics. Effective modeling involves not only capturing objects and bounding boxes but also documenting the business processes underlying data acquisition, preprocessing steps, and their potential biases, thus preserving meaningful variations while reducing noise and skew. Ultimately, structured AI data modeling bridges the gap between training datasets and the inputs required by advanced or popular AI models like Mask R-CNN or YOLO, enabling the creation of precise and reliable visual AI solutions.
Beyond Collection and Labeling
Even for deep learning approaches, simply gathering diverse data and applying bounding boxes or class labels is not enough. Data modeling digs deeper:
- Data Quality Checks: Are classes well-represented, or do some dominate the dataset? Are annotations consistent, or do boundaries vary drastically between labelers?
- Potential Biases: Could the input data disadvantage certain categories or demographics? Are certain object classes underrepresented, leading to skewed predictions?
- Relevant Metrics: Selecting the right key metrics ensures you accurately capture model performance across tasks like classification, detection, and segmentation.
By evaluating these factors early, you can correct issues before they propagate, ultimately reducing confusion and creating models that generalize more effectively.
Key Metrics for Evaluating Visual AI Data Models
Evaluating visual AI systems demands more than a single accuracy number. Here are some core metrics that help gauge AI models across different tasks:
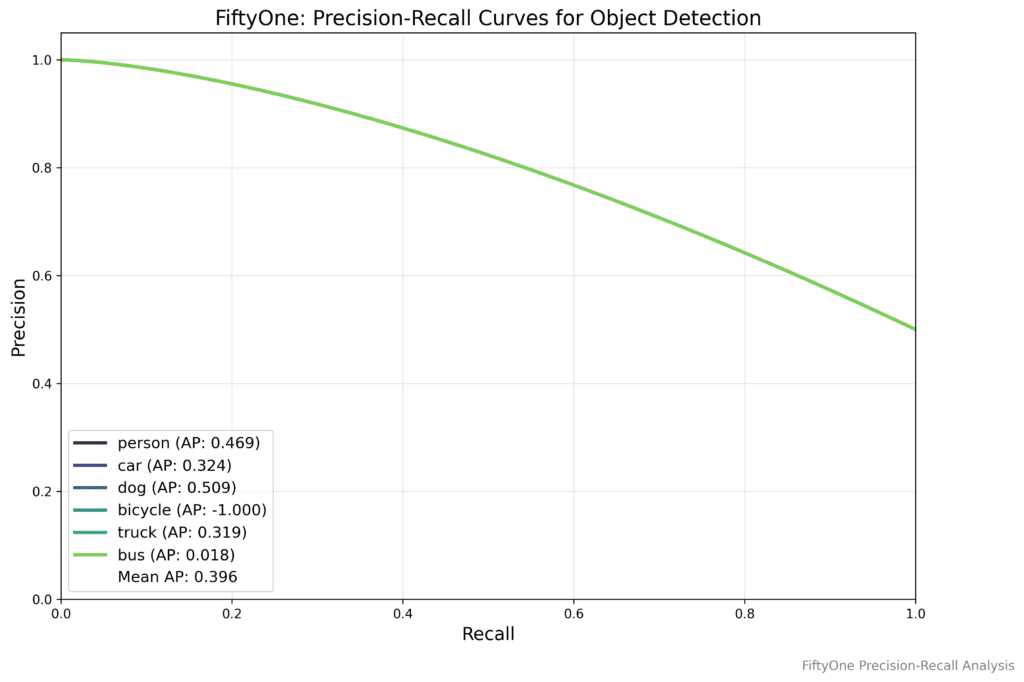
Object Detection
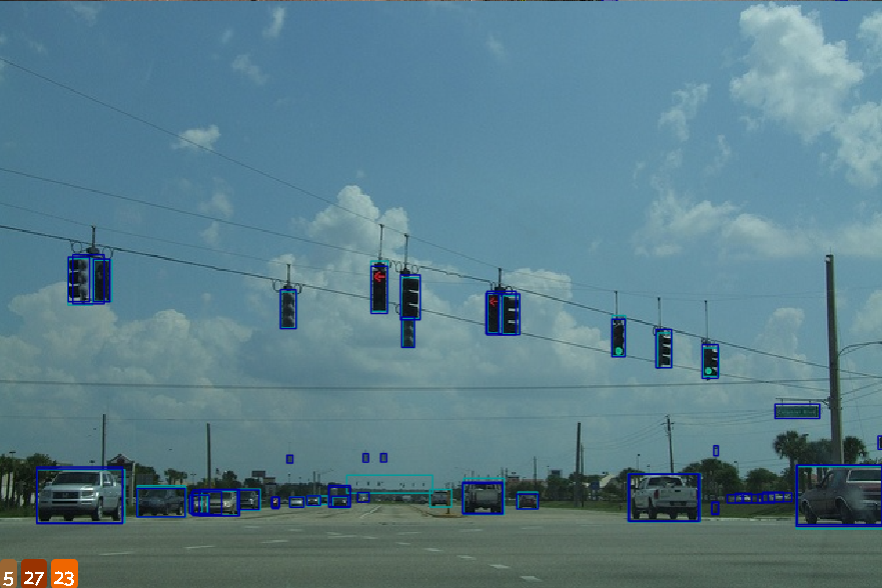
Object detection requires precise bounding boxes and accurate class labels. To evaluate detection accuracy, metrics such as Average Precision (AP) are commonly calculated at different Intersection over Union (IoU) thresholds, including AP@0.50 for strict bounding box overlap and AP@0.75 for a more lenient overlap. These metrics help determine how effectively a model localizes objects under varying degrees of precision. Additionally, localization errors can be evaluated by measuring the Center Point Distance, which quantifies how far a predicted bounding box center deviates from the ground truth, revealing difficulties with offset predictions. Analyzing Bounding Box Overlap separately from AP can further clarify whether bounding boxes systematically overshoot or undershoot actual object boundaries.
Image Classification
For image classification, you often rely on class probabilities:
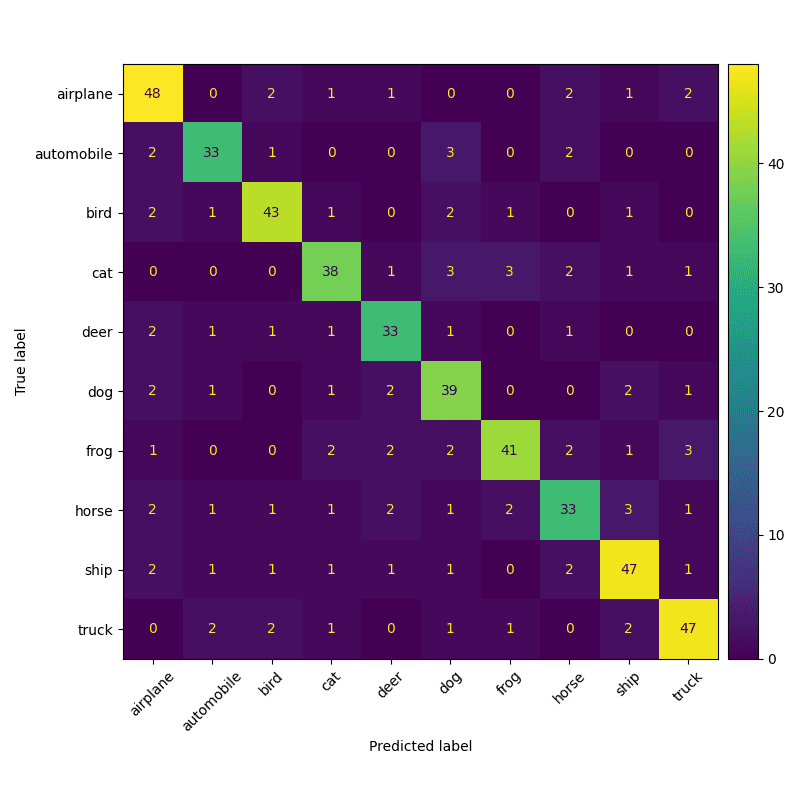
- Confusion Matrix Analysis
- A confusion matrix shows correct predictions along the diagonal and misclassifications elsewhere. This helps identify which classes are most confused with one another and highlights potential model biases or labeling issues.
- Calibration Curves
- Calibration curves map predicted probabilities against actual outcomes. If your data modeling pipeline produces models that are consistently overconfident, calibration analysis can reveal where to adjust thresholding or weighting.
Semantic Segmentation
Semantic segmentation assigns a class label to every pixel, making precise metric evaluation essential to gauge model quality, especially in scenarios involving imbalanced datasets or complex object shapes. Metrics like Mean Intersection-over-Union (mIoU) assess overall segmentation performance by averaging the IoU across all classes, while Weighted IoU addresses class imbalance by assigning higher importance to critical, underrepresented classes. Similarly, evaluating boundary accuracy through metrics such as the Boundary F1 Score ensures the precision of object delineation, particularly for thin or irregular shapes. The following Python functions provide compact implementations for these key metrics:
import numpy as np
# Mean IoU (mIoU)
def mean_iou(cm):
    return np.nanmean(np.diag(cm) / (cm.sum(1) + cm.sum(0) - np.diag(cm)))
# Weighted IoU
def weighted_iou(cm, weights):
    return np.nansum((np.diag(cm) / (cm.sum(1) + cm.sum(0) - np.diag(cm))) * weights)
# Boundary F1 Score
def boundary_f1(pred, true):
    tp = (pred & true).sum()
    precision = tp / (pred.sum() + 1e-6)
    recall = tp / (true.sum() + 1e-6)
    return 2 * precision * recall / (precision + recall + 1e-6)
Using these metrics during data modeling allows for precise quantification of segmentation performance, enabling targeted refinements in datasets and predictive models.
Beyond Pixel-Level Accuracy
Even advanced metrics like IoU or AP only partially reflect real-world performance. Data modeling for artificial intelligence should also address explainability and fairness:

Explainability Metrics
- Feature Importance
- Techniques can identify which input data regions or attributes drive the model’s decisions. For instance, saliency maps can highlight critical portions of an image.
- Attribution Methods
- Methods like Grad-CAM or SHAP reveal which parts of the image the model weights most heavily. This is particularly relevant in high-stakes domains (e.g., medical imaging) where it’s crucial to understand why a model flagged a specific region.
Fairness and Bias Metrics
AI systems should be designed to perform equitably and consistently across various demographic groups or classes. When a model achieves good results for certain groups but demonstrates poorer performance for others, it may reinforce existing biases present within the underlying data structures or highlight critical omissions in the data collection process.
Evaluating model performance using group-based metrics is essential to addressing this issue. Specifically, analyzing results such as object detection accuracy across different demographics or geographic locations can reveal hidden biases within the model and data, allowing for corrective measures that promote fairness and inclusivity.
Leveraging FiftyOne for Data-Driven Metric Analysis
One of the most effective ways to operationalize the above metrics is to use data modeling tools like FiftyOne. FiftyOne helps you manage your valuable data assets by allowing you to interactively visualize results and query subsets for targeted analysis.
Interactive Visualization of Metrics
FiftyOne supports:
- Precision-Recall Curves: Adjust thresholds to see how your model’s false positives trade off against false negatives in real time.
- Confusion Matrices: Identify persistent misclassification patterns and evaluate how well each label is represented.
- Segmentation Masks: Overlay predicted masks on ground truth to see pixel-level discrepancies, especially at object boundaries.
Filtering and Querying for In-Depth Analysis
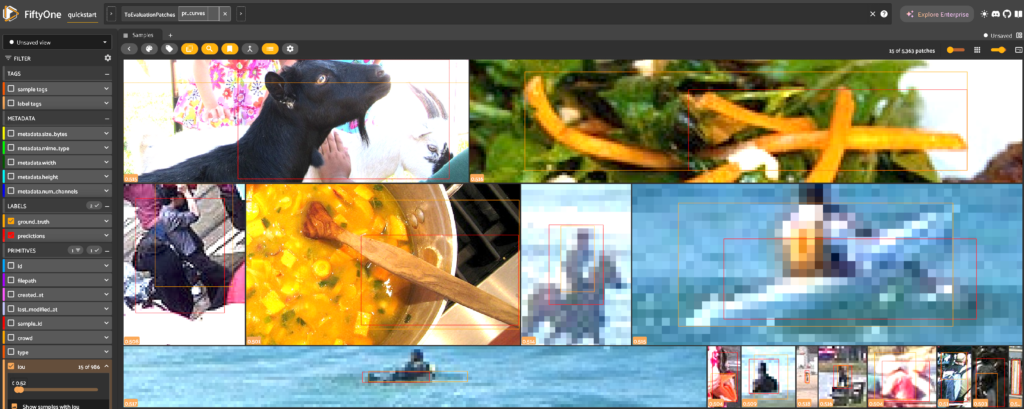
FiftyOne lets you slice and filter data in powerful ways:
- Difficult Examples: Quickly isolate images with poor IoU or bounding box overlap. These “failure samples” often highlight the biggest gaps in your data modeling approach.
- Low-Confidence Predictions: Examine predictions where the model is uncertain. Such cases might indicate insufficient training data or overly complex object classes.
Iterative Refinement of Data Models
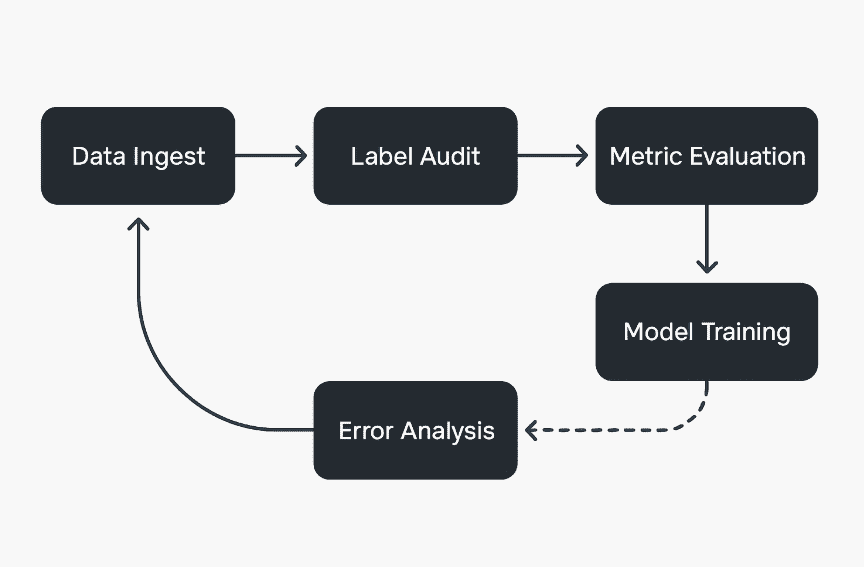
Because business processes evolve and new input data continuously arrives, data modeling is never “one and done.” FiftyOne promotes:
- Data Analysis: Explore how your model behaves on specific subsets or problem classes.
- Metric Evaluation: Re-run metrics like AP, IoU, or confusion matrices to see if changes in the dataset or model architecture lead to real improvements.
- Model Refinement: Incorporate newly discovered insights into revised training pipelines (e.g., balancing underrepresented classes or adjusting thresholding logic.)
Final Insights
The Importance of Selecting the Right Metrics
Building precise visual AI solutions goes far beyond generating bounding boxes or pixel labels. Thorough AI data modeling involves selecting key metrics, from Average Precision for detection to IoU for segmentation and beyond, to capture model behavior accurately. It requires continual monitoring of model calibration, boundary accuracy, and fairness across different segments. Simply put, the data modeling process shapes how AI models perceive the world.
FiftyOne as an Essential Tool
FiftyOne transforms raw metrics into actionable insights, enabling data scientists to quickly pinpoint failure cases, analyze low-confidence predictions, and refine data models iteratively. By leveraging interactive visualizations and querying capabilities, you can streamline the creating models process, leading to more effective data modeling and improved performance over time.
The Future of Visual Discovery
As future trends in artificial intelligence bring new complexities—richer image data, larger neural networks, and evolving business processes, the need for robust data modeling only grows. The combination of metrics-driven strategies and advanced platforms like FiftyOne ensures your predictive models remain accurate, equitable, and ready for the next wave of challenges in visual AI.
Explore the Jupyter Notebook
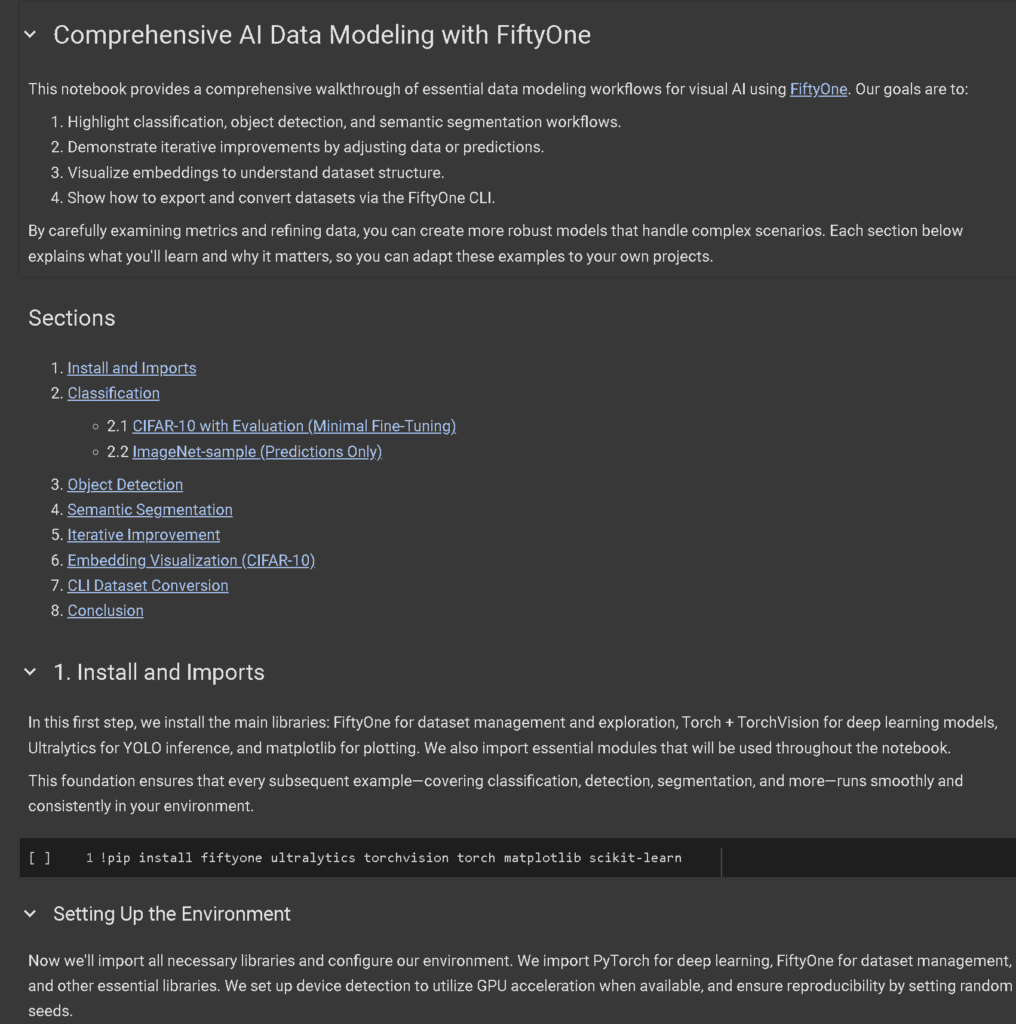
We’ve provided a companion Jupyter notebook <DataModeling.ipynb> that demonstrates:
- Classification (CIFAR-10, ImageNet-sample) with confusion matrices
- Object detection (COCO + YOLOv8) and IoU≥0.5 analysis
- Semantic segmentation (VOC + FCN-ResNet50) with binary IoU
- Iterative improvements via manual label fixes
- Embedding visualization (CIFAR-10) using PCA
- Dataset exports to multiple formats with FiftyOne’s CLI
Follow these examples to refine datasets, diagnose model errors, and streamline your AI workflow.
Image Citations
-
- Lin, Tsung-Yi, et al. “Microsoft COCO: Common Objects in Context.” COCO Dataset 2017 Validation Split, cocodataset.org, 2017, https://cocodataset.org/#home. Accessed 25 Mar. 2025.