The Smoothest Episode in the Batch Was Also a Failure: Motion Smoothness vs. Task Success in RoboLab-EgoX Policy Rollouts
Author

Hacker-in-Residence
Harpreet is Hacker-in-Residence at Voxel51, where he turns cutting-edge AI ideas into open-source prototypes and demos that push the boundaries of deep learning. From building tools that inspire to creating content that educates, Harpreet helps the AI community level up—one wild idea at a time.
See all articles by Harpreet Sahota
In this article
Key takeawaysWhat motion smoothness metrics measure, and what they can'tStep 1: Pick one task without downloading 21.8 GBStep 2: Build the dataset and pick your motion signalsStep 3: Score it, and work around a 5.4-second episodeStep 4: Read the ranking against the success labelThe RoboLab-EgoX episode that broke the storyWhat this means for triage, not gatesTry it yourselfFrequently Asked Questions
In this article
Key takeawaysWhat motion smoothness metrics measure, and what they can'tStep 1: Pick one task without downloading 21.8 GBStep 2: Build the dataset and pick your motion signalsStep 3: Score it, and work around a 5.4-second episodeStep 4: Read the ranking against the success labelThe RoboLab-EgoX episode that broke the storyWhat this means for triage, not gatesTry it yourselfFrequently Asked Questions
Try Voxel51 for yourself
A policy rollout scored smoother than 119 of its 127 peers on every motion metric a quality scorer knows how to compute, and it still failed the task. Here’s how that episode was found, and what it says about scoring robot data in general.
If you work with robot data, you’ve probably done some version of quality scoring without calling it that.
You watch a recording, and your eye picks out the obvious problems: a shaky reach, a hand that overshoots and corrects itself, a pause that goes on a beat too long. Over the last couple of years, that intuition has started getting turned into actual software. A handful of metrics, with names like spectral arc length and log dimensionless jerk, read a robot’s motion data and reduce it to a number per recording, so you can sort a folder of a hundred episodes by how rough or smooth each one looks instead of sitting through all of them yourself.
A real-world example clearly illustrates the limitations of these metrics. After scoring 127 attempts at a single manipulation task, an episode ranking among the top ten smoothest in the entire dataset turned out to be a total task failure. Despite failing its objective—placing a cube into a bowl—the recording triggered zero warning flags and showed no statistical anomalies. Because smoothness and task completion represent two distinct aspects of a recording, looking solely at arm trajectory smoothness reveals nothing about whether the goal was achieved.
This post walks through how that episode turned up: what dataset it’s in, how an open-source FiftyOne plugin scored it, and what the result does and doesn’t prove about scoring robot data more broadly.
Key takeaways
- Scoring all 127 episodes of
RubiksCubeTaskfromVoxel51/RoboLab-EgoXwith thedemo_quality_scorerFiftyOne plugin shows that motion smoothness does not predict task success. The task split 77 successes to 50 labeled failures, the best-balanced task in a 4,000-episode, 28-task corpus. - One episode,
RubiksCubeTask_cape_hill_sf0, instruction “Put the cube in the bowl,” labeledsuccess: False, ranks 8th-smoothest of all 127 episodes on the plugin’soverall_score. It trips zero flag thresholds and doesn’t register as a statistical outlier either. Every check the scorer runs comes back clean. - Smoothness correlates with success across the batch as a whole: the median
overall_scoreis 0.17 for successful episodes and 0.38 for failed ones, with lower values indicating smoother. This one episode is the exception, not proof the whole approach is broken. It’s rare enough that scoring stays useful and common enough that you can’t skip watching the episode yourself. - These episodes run for only 5.4 seconds at 15 frames per second, too short for the scorer’s automatic windowing, which is designed to target 100 samples per window. A manual override, down to a 2-second window, still produces a usable ranking, and the walkthrough below covers exactly where that workaround stops being trustworthy.
- The single smoothest episode in the entire batch, ranked first of 127, is also a labeled failure. But unlike
cape_hill_sf0, it does register on the scorer’s outlier tab, which makes it a weaker “this would have slipped through” story than an episode that clears every check, including outlier detection.
What motion smoothness metrics measure, and what they can't
A few years ago, robots that recorded their own sensor data mostly produced a pile of loosely related files: a video here, a CSV of joint angles there, maybe a separate GPS log if the robot moved outdoors.
Increasingly, that data gets recorded instead as a single file per attempt at a task, called an episode, which bundles every sensor stream together: cameras, LiDAR, joint encoders, the robot’s own estimate of its end-effector position, all ticking along at their own independent rates for as long as the task takes. The standard container for one of these files is MCAP, developed by Foxglove and now the default recording format for ROS 2. Because an MCAP file describes its own contents (what channels it has, what each one’s messages look like), any tool that understands the format can open a recording it’s never seen before without needing the original robot’s software.
FiftyOne is an open source tool for organizing, visualizing, and curating machine learning datasets, and as of version 1.19 it opens MCAP files natively.
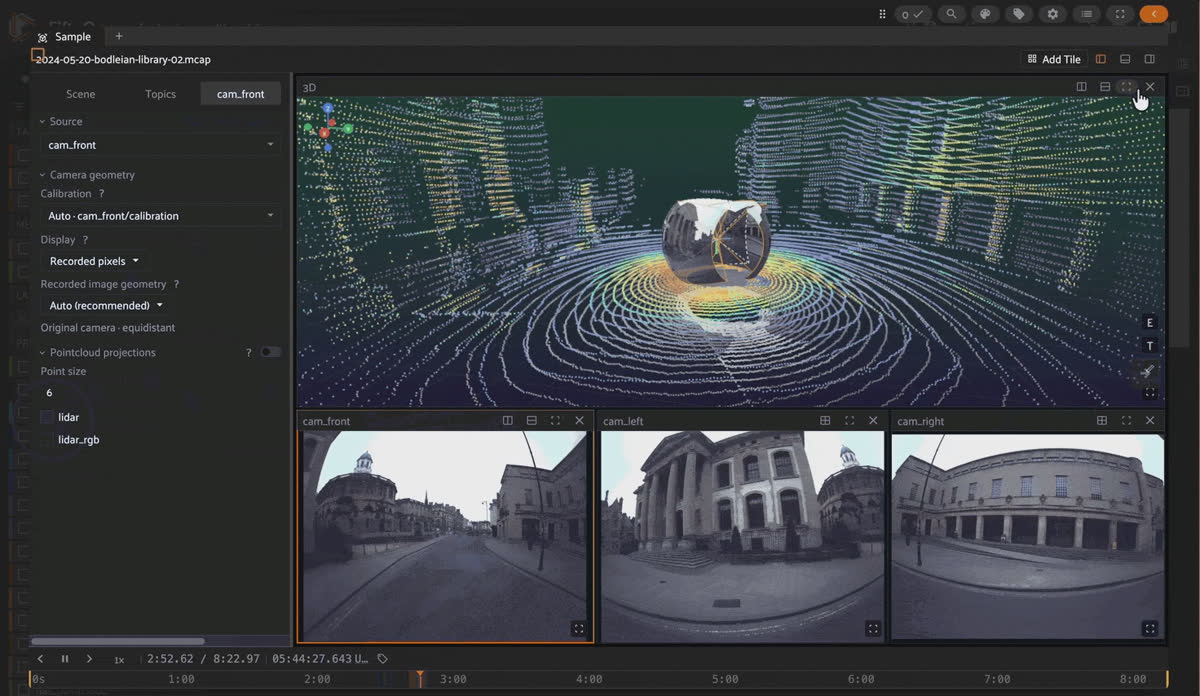
FiftyOne multimodal viewer playing an MCAP file, with a LiDAR point cloud in a 3D panel and three synced camera feeds below.
Point a sample at a
.mcap file, and FiftyOne decodes whatever cameras, point clouds, or robot-state channels it finds and lays them out in a synced, scrubbable viewer, just as it would show you images or video. That matters here because it’s what makes it practical to treat a folder of a hundred robot recordings as a dataset you can query, rather than a hundred files you’d otherwise have to open one at a time.After converting episodes into a searchable dataset, the next challenge is deciding which ones merit a human's time to inspect. That’s the job of a quality scorer: software that reads each episode’s sensor data and produces a handful of numbers meant to flag which recordings look rough, broken, or otherwise unfit to train on. This post uses one such tool, an open-source FiftyOne plugin called
demo_quality_scorer, and our analysis zeroes in on the specific metrics that practitioners typically rely on above all others: the measures of motion smoothness.Every smoothness metric relies on a speed profile as its foundational baseline, tracking the instantaneous velocity of a specific component—whether an individual joint or the end-effector. From that baseline, several distinct mathematical formulas evaluate specific facets of motion cleanliness:
- Spectral Arc Length (SPARC): Analyzes the frequency content of a speed profile and favors motion with low, concentrated energy, indicating a single deliberate movement.
- Log Dimensionless Jerk (LDLJ): Integrates the square of jerk over a recording and normalizes it for fair comparison across different window lengths.
- Jerk RMS: Provides a unit-based measurement of total jerk, making it effective for identifying localized rough spots.
- Low/High-Frequency Power Ratio: Evaluates whether motion energy stems from deliberate, slow movement versus rapid vibration or continuous correction.
Shared Limitation: All four metrics evaluate the movement signal itself rather than the task's actual success or outcome.
That core limitation encapsulates the central message of this article. When a robot fluidly and purposefully transports a cube to an incorrect location or releases it a millimeter shy of its target, its resulting velocity profile appears indistinguishable from a flawless execution. While the trajectory remains pristine, the end result falls short.
This exact issue motivated the design of
demo_quality_scorer: it serves as a triage tool rather than an automated filter. Scores dictate which recordings warrant human inspection first, rather than dictating automatic deletion. Comprehensive details on all plugin metrics—including outlier detection and sensor health checks—are available in two companion articles: Everyone Is Scoring Robot Data, Nobody Is Looking at It and Smooth Isn’t the Same as Correct.Below, we demonstrate a concrete, verifiable example of this vulnerability in action, identified by evaluating the scorer against an independent dataset.
Step 1: Pick one task without downloading 21.8 GB
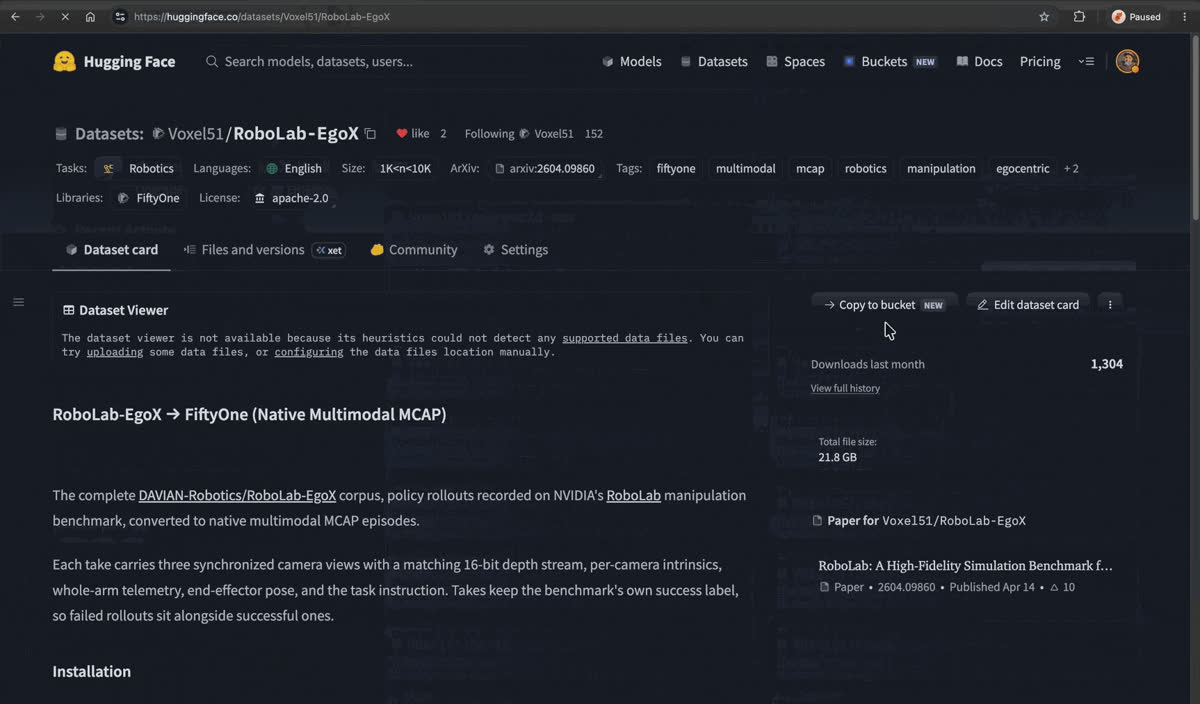
Browsing the Voxel51 organization on Hugging Face to the RoboLab-EgoX dataset card and its FiftyOne loading instructions.
The dataset used here,
Voxel51/RoboLab-EgoX, contains 4,000 .mcap episodes across 28 manipulation tasks, totalling 21.8 GB. Finding one interesting episode doesn’t require all of it. Alongside the actual recordings, the Hugging Face repo includes a samples.json manifest with every episode’s metadata (which task it belongs to, whether it succeeded, and how long it ran), a couple of megabytes with no video or telemetry attached. Reading that file first tells you exactly which 127 files, out of 4,000, are worth downloading:from huggingface_hub import hf_hub_download
import json
manifest_path = hf_hub_download(
"Voxel51/RoboLab-EgoX", "samples.json", repo_type="dataset"
)
samples = json.load(open(manifest_path))["samples"]
by_task = {}
for s in samples:
d = by_task.setdefault(s["task"], {"success": 0, "fail": 0})
d["success" if s["success"] else "fail"] += 1
# Sort for the best success/fail balance, not just the most episodes
best = sorted(by_task.items(), key=lambda kv: -min(kv[1]["success"], kv[1]["fail"]))
print(best[0]) # ('RubiksCubeTask', {'success': 77, 'fail': 50})Good to know. Why optimize for balance instead of raw episode count?
HammersInLeftBinTask has more episodes than any other task, 227 of them, but only 11 are successes. A task that’s almost entirely failures doesn’t give you a meaningful “typical success” to compare a “typical failure” against. RubiksCubeTask’s 77/50 split does, which is why it’s the one used for the rest of this post.With the task picked, downloading just its 127 files comes out to about 570 MB, a small fraction of the full dataset:
records = [s for s in samples if s["task"] == "RubiksCubeTask"]
for r in records:
    r["local_path"] = hf_hub_download(
        "Voxel51/RoboLab-EgoX", r["filepath"], repo_type="dataset", local_dir="./data"
    )
Step 2: Build the dataset and pick your motion signals
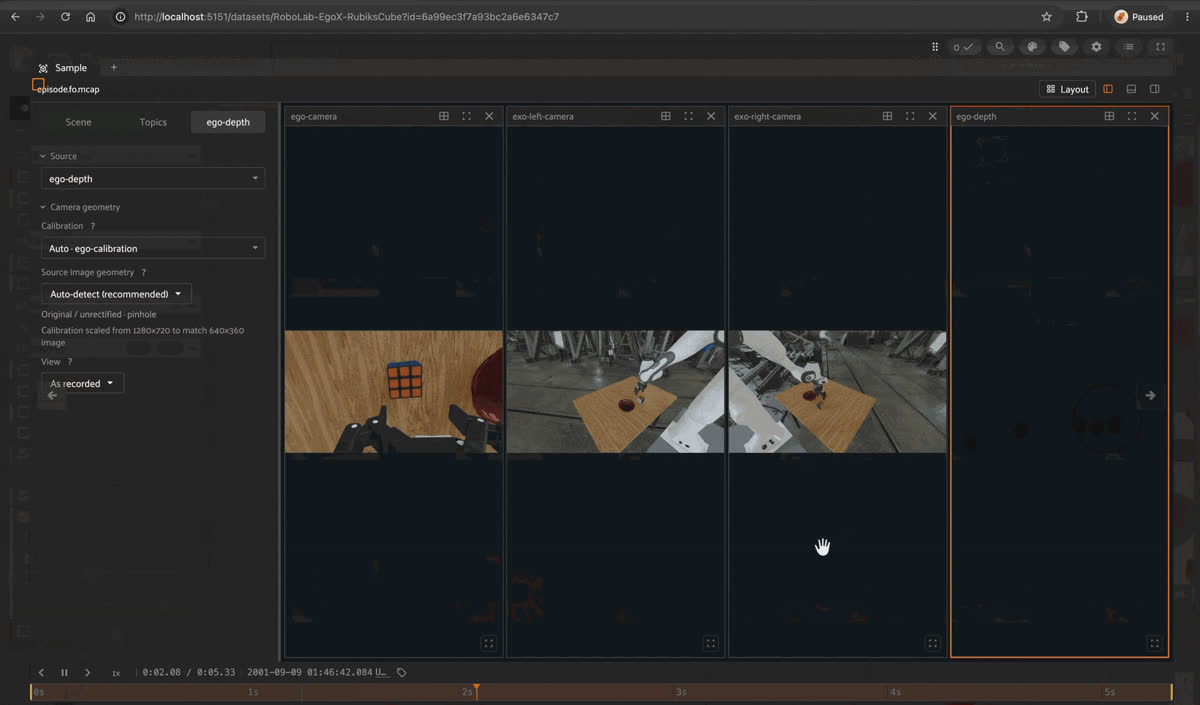
FiftyOne sample grid of RubiksCubeTask episodes, opening one episode's synced camera views and plotting its joint and action channels over time.
With the files on disk, building a FiftyOne dataset out of them is a matter of pointing each sample at its file and copying over whatever metadata is useful to query later:
import os
os.environ["VFF_MULTIMODAL"] = "1"  # set before fiftyone is imported, in every process

import fiftyone as fo

dataset = fo.Dataset("RoboLab-EgoX-RubiksCube", persistent=True)
dataset.add_samples([
    fo.Sample(
        filepath=r["local_path"],
        task=r["task"],
        take_name=r["take_name"],
        instruction=r["instruction"],
        success=r["success"],
        duration=r["duration"],
    )
    for r in records
])

print(dataset.media_type)  # multimodal
FiftyOne infers
media_type from the file extension, the same way it would recognize a .jpg as an image, so pointing a sample at an .mcap file is the entire import step. No importer class, no schema mapping.Before scoring anything, the scorer needs to know which of an episode’s channels actually represent the robot’s motion. This dataset ships a
/joint-positions channel (13 joint angles) and an /end-effector-pose channel, both readings of where the robot’s own body actually was. It also ships an /actions channel, which is the policy’s commanded output rather than a sensor reading: what the policy told the robot to do, not what the robot’s state ended up being. Scoring /actions would measure the policy’s intent instead of its execution, and those two can diverge exactly in the cases worth catching, so /joint-positions and /end-effector-pose are the two signals used here.Step 3: Score it, and work around a 5.4-second episode
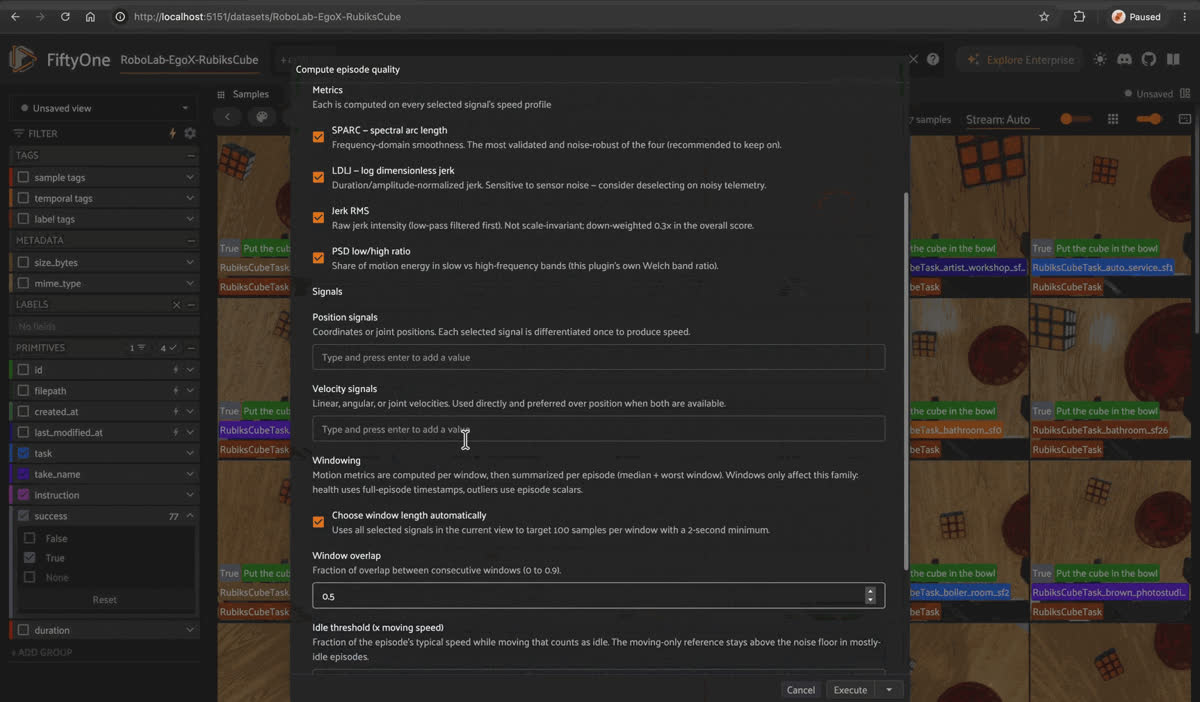
The demo_quality_scorer compute episode quality form in FiftyOne, with motion smoothness metrics, position signal pickers, and manual window settings.
demo_quality_scorer computes SPARC, LDLJ, jerk RMS, and the PSD ratio for each time window, then summarizes each episode in two ways: the median across all its windows and the worst window. Automatic windowing is built to target 100 samples per window, with a 2-second floor, which works well for episodes running tens of seconds to several minutes. It doesn’t work here. At 15 frames per second for 5.4 seconds, a RubiksCubeTask episode has 81 samples total, fewer than automatic windowing would even ask for in a single window.Install the plugin the same way you’d install any FiftyOne plugin:
import fiftyone.operators as foo

foo.execute_operator(
    "demo-quality-scorer/compute_episode_quality",
    dataset=dataset,
    params={
        "motion_enabled": True,
        "motion_cfg": {
            "position_signals": [
                '["/joint-positions","position"]',
                '["/end-effector-pose","pose_position"]',
            ],
            "auto_window": False,
            "win_s": 2.0,       # the plugin's own floor, and the shortest usable window
            "overlap": 0.5,
        },
        "health_enabled": True,
        "health_cfg": {
            "health_channels": ["/joint-positions", "/end-effector-pose", "/actions"]
        },
        "outliers_enabled": True,
    },
)
Keep it honest. A 2-second window on a 5.4-second episode, with 50% overlap between consecutive windows, works out to roughly four windows per episode. That’s enough for the plugin’s median-versus-worst-window summary to mean something, but nowhere close to the roughly 48 windows a longer, 87-second episode from a different corpus (
ABC-130k, covered in the companion posts above) would produce. Trust the overall ranking here; don’t lean too hard on any single window’s flag the way you could with a longer recording. As a sanity check, this episode was first scored within a 30-episode slice of the same task, then again across the full 127 episodes. Its rank held steady at 8th-smoothest both times, but the underlying z-scores shifted between runs, because they’re fit fresh against whatever batch you score. That’s a property of the method, not a bug: a score always means “relative to this batch,” never “relative to some universal scale.”Step 4: Read the ranking against the success label
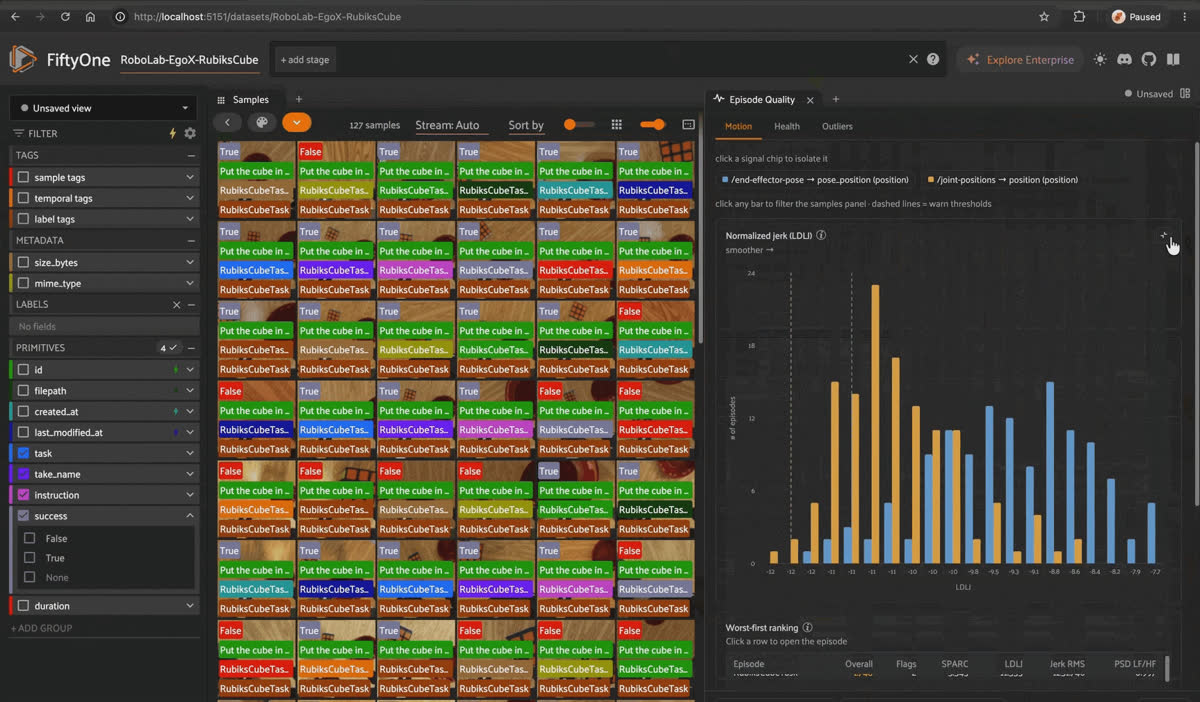
FiftyOne Episode Quality panel showing motion smoothness histograms and a worst-first ranking table for 127 RubiksCubeTask episodes, then filtered by success label.
Once scoring finishes, each sample includes a
quality field containing all computed metrics. Sorting by overall_score and printing the success label next to it is what actually surfaces the interesting cases:rows = sorted(
({
"take": s.take_name,
"success": s.success,
"overall": s.quality.overall_score,
"n_flags": s.quality.n_flags,
"outlier": s.quality.is_outlier,
} for s in dataset),
key=lambda r: r["overall"],
)
for r in rows[:10]:
print(r)Run that, and the ten smoothest episodes in the dataset print out worst-to-best by score, with
success: False sitting a few rows down from the very top instead of clustered at the bottom where you’d expect it.The RoboLab-EgoX episode that broke the story
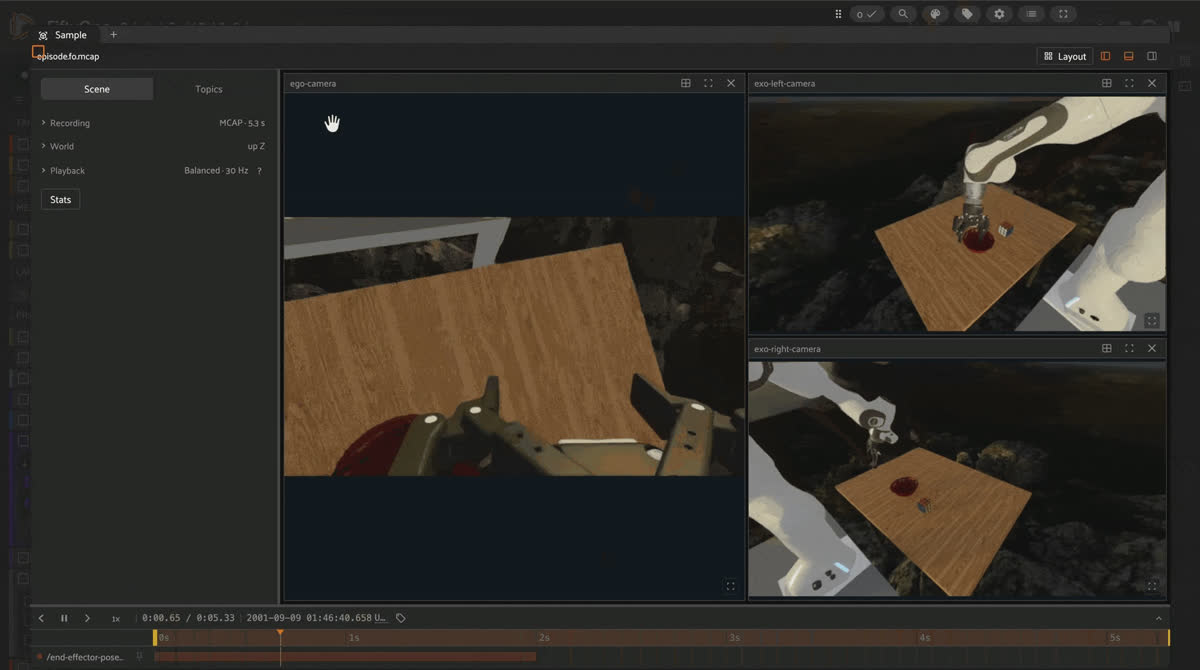
FiftyOne multimodal viewer of a RubiksCubeTask episode with ego and wrist cameras showing a robot arm above a cube and bowl, alongside the episode's channel list." Confirm this is actually cape_hill_sf0 before naming it so, since the post says neither episode has been watched.
RubiksCubeTask_cape_hill_sf0, instruction “Put the cube in the bowl,” success: False, has an overall_score of -0.30, which makes it the 8th-smoothest episode out of 127. Its SPARC (-2.69) and LDLJ (-8.76) both sit near the clean end of the batch’s own distribution, and n_flags reads 0, meaning nothing crossed a warn threshold on the episode’s median. It doesn’t show up on the outlier tab either; is_outlier: False. Every mechanism the plugin runs, scored the same way described above, comes back and says this episode is fine.For comparison,
RubiksCubeTask_photo_studio_01_sf0 is the single smoothest episode in the entire batch, ranked first of 127 with an overall_score of -0.85, and it’s also labeled success: False. That’s the more dramatic number of the two, but it does register as a statistical outlier (is_outlier: True): an isolation-forest and nearest-neighbor check, fit across the whole batch, flags it as unusual, even though unusual doesn’t automatically mean bad. cape_hill_sf0 also clears that check, which is why it's the cleaner example of the two. Nothing about it, not its smoothness scores and not its statistical profile, would have made anyone look twice.| Episode | Success label | Rank (of 127) | overall_score | is_outlier |
|---|---|---|---|---|
| RubiksCubeTask_cape_hill_sf0 | False | 8th smoothest | -0.30 | False |
| RubiksCubeTask_photo_studio_01_sf0 | False | 1st smoothest | -0.85 | True |
Keep it honest.
RoboLab-EgoX episodes are simulated policy rollouts recorded on NVIDIA’s RoboLab benchmark, not human teleoperation, so it’s worth saying plainly that this isn’t real-world hardware. The success field is the benchmark’s own ground-truth task-completion label, decided by the simulator, not a model’s prediction layered on after the fact.What this means for triage, not gates
Run this same scorer over a different corpus,
ABC-130k, 40 teleoperated manipulation episodes spanning 40 different tasks, and its single lowest-quality episode by verdict turns out to be a sensor dropout: a channel that simply stopped reporting partway through the recording. That’s a real, common failure mode, and the scorer catches it well, because dropout is fundamentally a timestamp problem and sensor-health metrics read exactly that. But it’s a different failure mode from a wrong-but-smooth action, and finding a real example of the second kind took scoring a second corpus, one with genuine success and failure labels to check the ranking against, rather than assuming ABC-130k would eventually produce one.That’s the actual argument for scoring episodes at all. Not that it replaces a person watching the recording, but that it tells that person which four episodes out of forty, or which eight out of a hundred and twenty-seven, are worth the ninety seconds it takes to look.
cape_hill_sf0 would never have made that list on smoothness alone; smoothness is exactly what says it’s fine. It made the list only because someone thought to sort by score and then cross-reference against a label the scorer itself never sees.Try it yourself
- Voxel51/RoboLab-EgoX on Hugging Face
- demo_quality_scorer on GitHub
- Everyone Is Scoring Robot Data, Nobody Is Looking at It, the full quality-metric stack, including sensor health and outliers
- Smooth Isn’t the Same as Correct, SPARC, LDLJ, jerk RMS, and the PSD ratio worked through in detail
- Open MCAP Robotics Logs in FiftyOne, No ROS Needed, what the multimodal viewer actually does with a file like this
Frequently Asked Questions
One continuous recording of a robot attempting a task, start to finish, with every sensor it carries (cameras, joint encoders, whatever else is onboard) logged together on a shared timeline rather than split into separate files. It’s the natural unit for this kind of data because the sensors are all ticking at their own independent rates for the same stretch of time, and splitting that into individual frames or per-sensor files throws away the relationships between streams that actually matter.
Because 2 seconds is already the plugin’s floor, not an arbitrary choice made for this post.
AUTO_MIN_WINDOW_S in demo_quality_scorer’s own windowing code is set to 2.0 regardless of what automatic windowing would otherwise compute for a given signal. There’s no smaller manual value that stays meaningful for a duration-sensitive metric like LDLJ, whose value scales roughly with window length to the fourth power, which means comparing windows of different lengths to each other isn’t valid in the first place.No, it’s simulated. The episodes are policy rollouts recorded on NVIDIA’s RoboLab manipulation benchmark and converted to MCAP by Voxel51, not real-world teleoperated demonstrations collected on physical hardware. The finding here, that smoothness and task success are different properties a scorer can’t conflate, generalizes well beyond this one dataset. The specific numbers and the specific episode do not represent physical hardware, and that distinction is worth repeating whenever this example comes up.
Only relative to whatever batch it was scored against.
overall_score is a weighted mean of z-scores, fit fresh every time the scorer runs, oriented so that a higher number always means worse. That makes it useful for ranking episodes within a single run, but it’s not comparable across different scoring runs, different signal choices, or different datasets. A score of -0.30 in this batch says nothing about what -0.30 would mean in a different one.Only that no individual metric’s episode-level median crossed the warn threshold (a z-score of 2 or higher) against this batch’s own distribution. It doesn’t rule out one rough window inside an otherwise clean episode, which
demo_quality_scorer tracks separately as a flagged interval, and it says nothing at all about whether the task was actually completed, which is not something any motion metric here is designed to measure.Because smoothness metrics measure how the arm moved, not whether the cube landed in the bowl, so a fluid trajectory to the wrong place scores as clean.
Hacker-in-Residence
Harpreet is Hacker-in-Residence at Voxel51, where he turns cutting-edge AI ideas into open-source prototypes and demos that push the boundaries of deep learning. From building tools that inspire to creating content that educates, Harpreet helps the AI community level up—one wild idea at a time.
See all articles by Harpreet Sahota
Try Voxel51 for yourself
Loading related posts...
© 2026 Voxel51 All Rights Reserved


