Voxel51 Data Curation
Model performance is only as good as the data behind it. Voxel51 helps you search, analyze, and refine your datasets at every stage of development — so you're training on high-signal data, not just more data.
Data Agent
Automate repetitive data work with Voxel51 Agent
Ask questions about your data in natural language. Build custom workflows to automate repetitive curation tasks to move faster.
Data Exploration
Visualize and understand your data
80% of AI projects fail due to data issues. Gain full visibility into your datasets before training.
Multimodal data visualization
Explore synchronized episodes across multiple modalities on a shared timeline, preserving the temporal relationships between them.

Temporal tags let you mark and organize specific time ranges within an episode so important behaviors, events, and conditions can be searched, filtered, and reviewed across your dataset.

Grouped datasets
Grouped datasets let you organize, analyze, and query related samples across multiple modalities or perspectives while preserving the relationships between them.
Streamline visual data discovery
Stop waiting days for data teams to deliver samples. Query your data lake and retrieve relevant samples in seconds using Data Lens.

Distribution
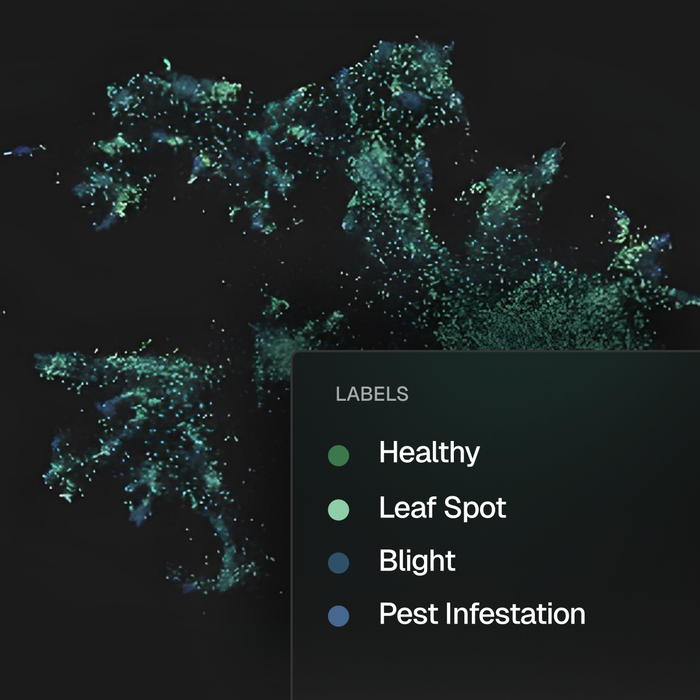
Poor data distribution can lead to bias and blind spots. Use embeddings visualizations to understand how your data is spread across key features and classes.
Balance
Ensure each class in your dataset is proportionately represented. Balanced datasets help prevent performance bias toward overrepresented classes, improving fairness and robustness.

Improve data quality
Transform noisy datasets into high-signal training data
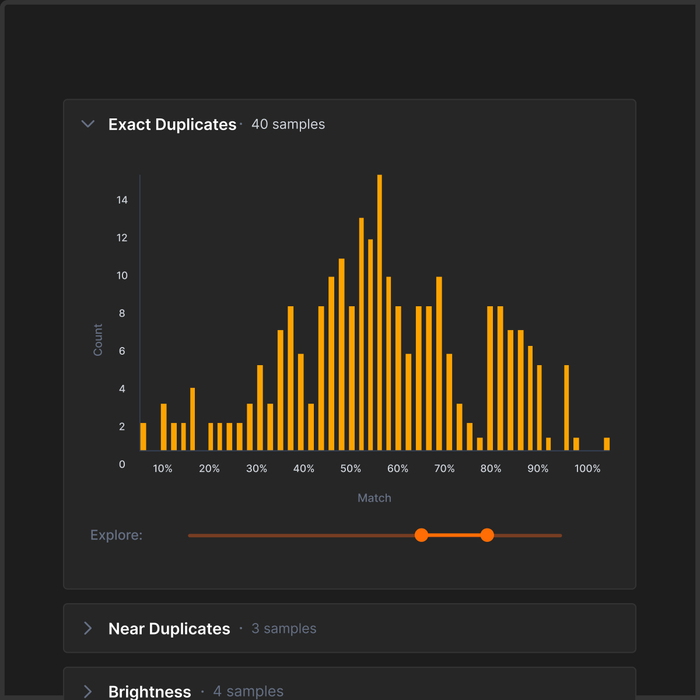
Automate quality checks to instantly isolate low-value samples, correct label errors, and produce high-signal training sets.
Improve data quality
Use automated quality signals to prioritize the episodes and segments that need review.

Remove redundant data

Build balanced training sets

model performance
Continuously improve model accuracy
Catch failure modes before your users do. Automatically feed high-value failure cases directly back into active learning pipelines.
Avoid model drift
Model drift can degrade performance in production environments. Use active learning workflows to systematically monitor, identify, and correct dataset shifts, ensuring consistent model performance over time.
Select high value episodes for training
Use model signals and dataset structure to prioritize the examples that add the most value. Mine hard cases, surface underrepresented scenarios, and build targeted training sets instead of retraining on everything.
Questions?
We have answers.
Data curation involves systematically selecting, managing, and refining datasets to ensure high quality and relevance. Effective curation improves model accuracy, reduces training costs, and accelerates AI development by identifying valuable, representative data.
When selecting a data curation solution, evaluate its capabilities for handling your data types and volumes, ease of integration into your existing workflows, scalability for enterprise workloads, and tools for visualizing, querying, and refining datasets. Look for solutions that offer intuitive interfaces, advanced dataset exploration, and automation features to efficiently identify and manage high-value data, ultimately improving your model's performance and reducing project costs.
Curating your dataset enables targeted removal of noisy, redundant, or irrelevant data, ensuring your models train on high-quality samples. This leads directly to improved model accuracy, reduced annotation expenses, and faster time-to-deployment.
Voxel51 provides intuitive workflows for visualizing, querying, and refining visual datasets at scale. Features like similarity search, error analysis, and automated dataset management simplify curation tasks and ensure you're training models on the most valuable data.
© 2026 Voxel51 All Rights Reserved