Smooth Isn't the Same as Correct: Triaging Robot Episode Quality with FiftyOne
Author

Hacker-in-Residence
Harpreet is Hacker-in-Residence at Voxel51, where he turns cutting-edge AI ideas into open-source prototypes and demos that push the boundaries of deep learning. From building tools that inspire to creating content that educates, Harpreet helps the AI community level up—one wild idea at a time.
See all articles by Harpreet Sahota
In this article
Key takeawaysTriage, not autofilterWhat the episode quality metrics actually measureAggregate the way you'll use the resultAn outlier is not the same as a bad demoTwo time scales, two different questionsChoosing the parametersWhich metrics for which jobRunning this as a panel: episode qualityTry it yourselfFrequently Asked Questions
In this article
Key takeawaysTriage, not autofilterWhat the episode quality metrics actually measureAggregate the way you'll use the resultAn outlier is not the same as a bad demoTwo time scales, two different questionsChoosing the parametersWhich metrics for which jobRunning this as a panel: episode qualityTry it yourselfFrequently Asked Questions
Talk to an AI expert
A framework for triaging multimodal robot-episode datasets before you train on them, plus the FiftyOne panel that runs it end to end.
Opening the Episode Quality panel from the panel menu on the ABC-130k teleop dataset in the FiftyOne App.
Picture a teleop episode where the operator reaches for the wrong bin. The reach itself is clean: no jitter, no correction, no hesitation. Every smoothness metric you could run on it comes back perfect. The episode is still garbage, because the robot did the wrong thing smoothly.
That's the ceiling on automated curation for multimodal episodes. Motion metrics score how an action was executed, never what the action was. A wrong-but-smooth grasp, a right turn where the task needed a left, a confident hand-off to the wrong object — none of it shows up in a spectral-arc-length number or a jerk histogram. Only a human watching the clip catches it.
Once you accept that ceiling, automated scoring has one honest job left: pointing a person's limited attention at the handful of hours, out of hundreds, most likely to contain a real problem. That's triage. It's also the design constraint behind every metric below.
Everything here is domain-general — the same math runs on manipulation, AV, UAV, and rover logs. To keep it concrete rather than abstract, every number in this post comes from one real corpus: 40 episodes of bimanual teleop from Voxel51/ABC-130k, each a different task, recorded at 29.8 Hz across 23 MCAP channels.
Key takeaways
- Motion-smoothness metrics are action-only. On ABC-130k the smoothest and roughest episodes differ by 4.55 SPARC units, and none of that spread tells you whether the robot did the right thing.
- Literature reference values don't transfer. Healthy human reaching sits near SPARC ≈ -1.6 and LDLJ ≈ -6; ABC-130k's medians are -2.92 and -14.61. Rank within your own corpus instead of importing an anchor.
- Averaging signals hides problems, and it hides them even when the raw numbers look close.
/left-ee-state's fitted bad-tail spread for jerk RMS (265.5) is nearly 6x/left-arm-state's (44.7), so an identical raw jerk value is a shrug on one and a flag on the other. Score each signal separately and roll up worst-of. - Outlier scores measure unusual, not bad. Both detectors rank the same three ABC-130k episodes on top: folding a t-shirt, folding a paper plane, and putting a screwdriver in a bin. Plausibly the most dynamic tasks in a 40-task batch, not the worst demos.
- Sensor health rolls up worst-of too, and that has teeth: dropout and desync come back clean on ABC-130k (0.00 median dropout, worst-pair desync 0.17 ms), but one gripper's aperture reading pinned near its physical limits drives the composite clipping score to 81% on one episode even though every arm channel stays under 2%.
- Episode scores and interval flags answer different questions. The worst-scoring episode (
overall_score+3.65) carries only 2 flagged spans; the second-worst carries 39.
Triage, not autofilter
The instinct once you have a quality score is to sort by it and cut the bottom slice. Resist that for as long as the metric is action-only, which for motion smoothness is always.
Good to know. Doesn't a bad demo usually look rough too? Often, yes — operator fatigue, kickback after contact, and hesitation-driven jitter all show up as real roughness, and that's most of what these metrics catch. A clean pass just tells you nothing about correctness, so a low score is a reason to look, never a reason to skip looking.
Keep it honest. Structural errors are invisible to every metric in this framework, including the outlier detectors. If your review process ever skips watching a flagged episode because the score looked fine, triage has quietly become autofilter, and you've lost the one check that catches wrong actions.
What the episode quality metrics actually measure
Every motion metric runs on the same input: a speed profile, the scalar magnitude of velocity for one explicitly-selected signal — a
channel -> field group pair you pick as Position or Velocity in the operator form. Position signals are differentiated once, scaled by the sampling rate so the result is per second rather than per sample; Velocity signals are used directly. Nothing is guessed from a field name: you choose exactly which signals are motion, so an acceleration, covariance, or orientation field group only gets scored if you deliberately select it, and physical units never mix inside jerk_rms by accident.Each selected signal is uniformly resampled onto its own median-rate time grid before anything else runs. Dropout-sized gaps stay invalid rather than getting linearly smoothed over, and there's still no cross-channel alignment — two signals on independent clocks are windowed on their own grids, never forced onto a shared one.
Motion smoothness
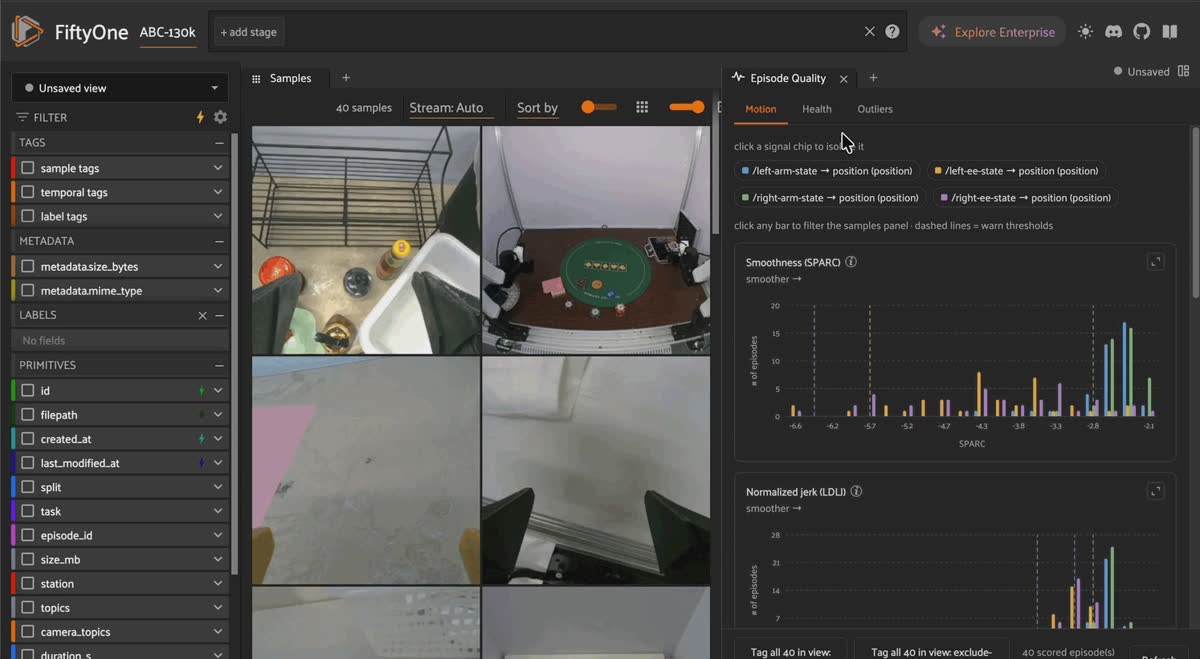
Compute episode quality form with SPARC, LDLJ, jerk RMS, and PSD ratio toggles and signal pickers, then per-signal smoothness histograms in the Motion tab.
Spectral Arc Length (SPARC) —
sparc. Take the FFT of the speed profile, normalize the magnitude spectrum to a peak of 1, keep the band below fc (10 Hz default) where magnitude clears 0.05, and measure that curve's arc length. Negate it so higher reads better. Smooth motion has a compact spectrum and traces a short arc; corrections, tremor, and micro-stops add ripple that lengthens it.SPARC is the most trustworthy of the four because both normalizations remove a nuisance variable: dividing by the peak drops amplitude, and normalizing the frequency axis to the measured band's own width drops duration. That's what makes its values comparable between a 2-second window and a 20-second one, where LDLJ's aren't. It doesn't make a number from someone else's platform meaningful on yours. ABC-130k lands at a median of -2.92, spanning -6.75 to -2.21.
Log Dimensionless Jerk (LDLJ) —
ldlj. Integrate squared jerk over the window, scale by duration³ / peak_speed² to make it unitless, then take the negative log. Same idea as SPARC by a different route, and worth running alongside it because the log compresses large differences that SPARC still separates.Watch the duration term. Dimensionless jerk carries
duration³ and its integral grows with duration too, so the whole quantity scales as roughly duration⁴ — halving a window's span adds about 2.8 to the result on identical motion. LDLJ values are only comparable across equal-length windows, which is why the scorer emits complete windows only and discards a short trailing one.Root-Mean-Square Jerk —
jerk_rms. Low-pass the speed profile (4th-order zero-phase Butterworth, 10 Hz default), trim the samples most affected by the filter's edge padding, differentiate twice, take the RMS. The filter is not optional: differentiating twice amplifies noise by ω², so unfiltered RMS jerk on real telemetry is mostly noise.This one keeps its physical units (rad/s³ or m/s³ depending on the channel), so there's no universal good or bad value, and it covaries with the other three. Both facts are why it's down-weighted to 0.3 in the composite score. It earns its keep localizing rough intervals, where a spike is unambiguous.
Low/High Frequency Power Ratio —
psd_lf_hf. Welch power spectral density of the speed profile, low-band power over high-band power (split at fs/4), returned as a natural log. Clean purposeful motion concentrates energy at low frequencies; vibration and correction push it high.The log matters more than it looks. A bare ratio is bounded on its bad side, since it can only fall from the corpus median to 0, while a smooth window's ratio runs arbitrarily high. Fit a robust z-score on that and the metric can never reach the warn threshold in the rough direction no matter how rough the motion gets. Measured on real per-window data before the change, it flagged 0.00% of windows on every channel.
Idle Fraction —
idle_frac. Share of a window's samples whose low-passed speed sits below idle_alpha (0.05 default) times the episode's own moving speed.The reference is the episode's speed while it's moving, not its median speed. A median-relative threshold inverts on exactly the episodes the metric exists to catch: once an episode is more than half idle, its median speed is the idle floor, so the threshold collapses into sensor noise. On one real ABC-130k channel that was genuinely idle 82% of the time, the median-based version reported 18.5%.
idle_frac never enters overall_score. A long pause can be grasp settling, waiting at a light, or a legitimate part of the task, so it's a flag, not a verdict.Sensor health
After a scoring run, the multimodal viewer opens with a jerk RMS fail flag notification on the left arm channel and scrubs to the flagged interval on the timeline.
Almost all of this is timestamp arithmetic — inter-arrival deltas, a nearest-neighbor offset between two channels, a slope between two clocks. None of it cares what's inside the message, so it works identically on a joint-state topic and a GPS fix. That also makes it close to a free first pass: before you spend compute on smoothness or outlier fitting, timestamp checks already tell you which episodes have a dropped channel or two sensors quietly out of sync.
Dropout —
health.dropout. Gaps running past 3× a channel's own median inter-arrival time, weighted by how many messages each gap swallowed, expressed as the estimated fraction of expected messages that never arrived. The weighting is the point: a 100-message dropout and a 4-message one are very different events that score identically if you only count gaps.Cross-Channel Desync —
health.desync_ms. For each pair of channels, match every message in the sparser one to its nearest neighbor in time in the other, and report the 10th percentile of those offsets; the episode reports its worst pair.A low percentile, deliberately. Two perfectly synchronized channels at 30 Hz and 10 Hz still show a median offset near a quarter of the denser channel's period, purely because the sparse channel's timestamps land at arbitrary phase — so a median-based version was largely reading rate mismatch. The trade is a blind spot for intermittent desync, and nearest-neighbor matching can't see skew that's a whole multiple of the denser channel's period at any percentile.
Clock Drift —
health.clock_drift_ppm. Slope of log_time - publish_time across the episode, in parts per million. Hardware crystals drift around ±10 ppm; hundreds of ppm means a clock is misbehaving and your timestamps need recomputing.This one reports unavailable rather than 0.0 when it doesn't have two genuinely distinct clocks. Many recorders set
publish_time equal to log_time, which makes every offset identically zero and the fitted slope zero too — and reporting that as zero drift would claim a clean bill of health for a clock nobody measured.Rate Stability —
health.rate_cov. Robust coefficient of variation of inter-arrival times, built from a median absolute deviation rather than a standard deviation. A plain standard deviation lets one dropout gap dominate the jitter metric, double-counting an event dropout already reports.Clipping —
health.clipping_frac. Fraction of samples pinned within a small tolerance of the channel's own observed minimum or maximum. There's no way to read a sensor's real limits out of an MCAP file, so the observed range is the proxy, which makes this a heuristic rather than a calibrated check.Constant and boolean dimensions are excluded. A constant field sits at both its own extremes at once and a gripper open/close flag is at an extreme in every sample, so both used to read as permanently 100% saturated — and since clipping feeds the composite score, one status bit was enough to inflate every episode carrying it.
Keep it honest. Health rolls up the same way motion does: worst channel wins, not the average. On ABC-130k, the two arm channels stay clipping-clean (median under 1%, worst case 19%), but the two gripper channels routinely spend part of an episode pinned at fully open or fully closed — median clipping around 10%, one episode as high as 81% on
/right-ee-state. Because the episode-level health.clipping_frac takes the worst channel, that one gripper reading is enough to move the whole episode's health score, exactly the point of a triage metric: an arm that never saturates doesn't get to cancel out a gripper that does.Outliers
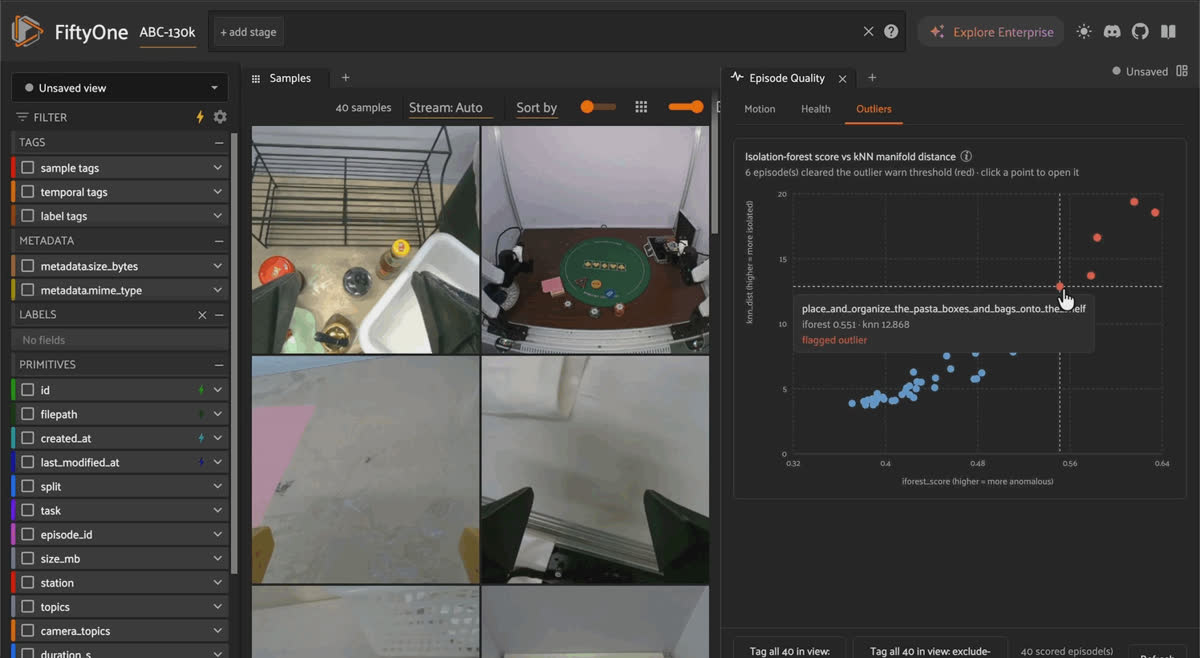
Outliers tab scatter of Isolation Forest score against kNN distance for 40 ABC-130k episodes, with the six flagged outliers in red.
Both models fit across the whole batch at once, on the episode-level metrics you just computed — robust-z-scored and sign-oriented first, so every column is on a comparable scale before any distance is taken.
Isolation Forest —
iforest_score. Repeatedly split the batch's metric matrix at random; an episode that takes very few splits to separate is anomalous. Higher is more anomalous, dataset-relative, no absolute scale.k-Nearest-Neighbor Distance —
knn_dist. Mean distance from an episode to its 5 nearest neighbors in that same metric space. Sitting far from even your closest peers is the flag.Keep it honest. These fit on per-episode summary metrics, not on per-timestep state trajectories. That limitation is worth naming, because there's an appealing story it rules out. The story goes that an off-manifold detector catches the wrong-but-smooth action a smoothness metric misses, since a wrong action still drives the robot into unusual states. That would need state-space features these models don't have. What they catch is an episode whose summary statistics are unusual for the batch. Structural errors remain a human's job.
Rolling it up
Overall Score —
overall_score. Every enabled metric's robust z-score, weighted and averaged, oriented so higher is always worse. 0 is typical for this batch; ≥2 is the warn threshold, ≥3 is fail; large negative values are your cleanest episodes.The z-score's denominator is fit from each metric's bad side only — the semi-interquartile range above the median for a higher-is-worse metric, below it otherwise. A two-sided MAD averages the narrow good side into the scale of a strongly skewed distribution, and real per-window jerk RMS skews hard. That understated the bad side's spread badly enough to put 33% of all windows past the fail threshold, against the 0.13% a normal distribution predicts.
Flag Count —
n_flags. How many metrics cleared z ≥ 2. Higher means more independent signals agree something's off. On ABC-130k, 19 of 40 episodes have zero flags and the worst has four.Values only mean anything within a run. Every sample carries
quality.config_version, and the panel refuses to blend versions into one ranking.Aggregate the way you'll use the result
Most multimodal episodes carry more than one motion-relevant channel: two arms, four wheels, a gimbal and a base. The tempting move is to average across them into one smoothness number per episode. Don't — averaging optimizes a different question than triage asks.
RINSE (arXiv:2604.23000) averages smoothness over both arms when filtering bimanual training data, validated against downstream policy success. That's the right call for their objective, which tolerates one arm compensating for another. Triage asks something narrower: is there anything here a human should see. Average a jerky right arm against a smooth left one and you get a moderate, unremarkable score — exactly the episode a reviewer needed flagged.
ABC-130k makes the mechanical reason obvious too. Selecting each
*-state channel's Position signal (four signals total), median jerk RMS runs: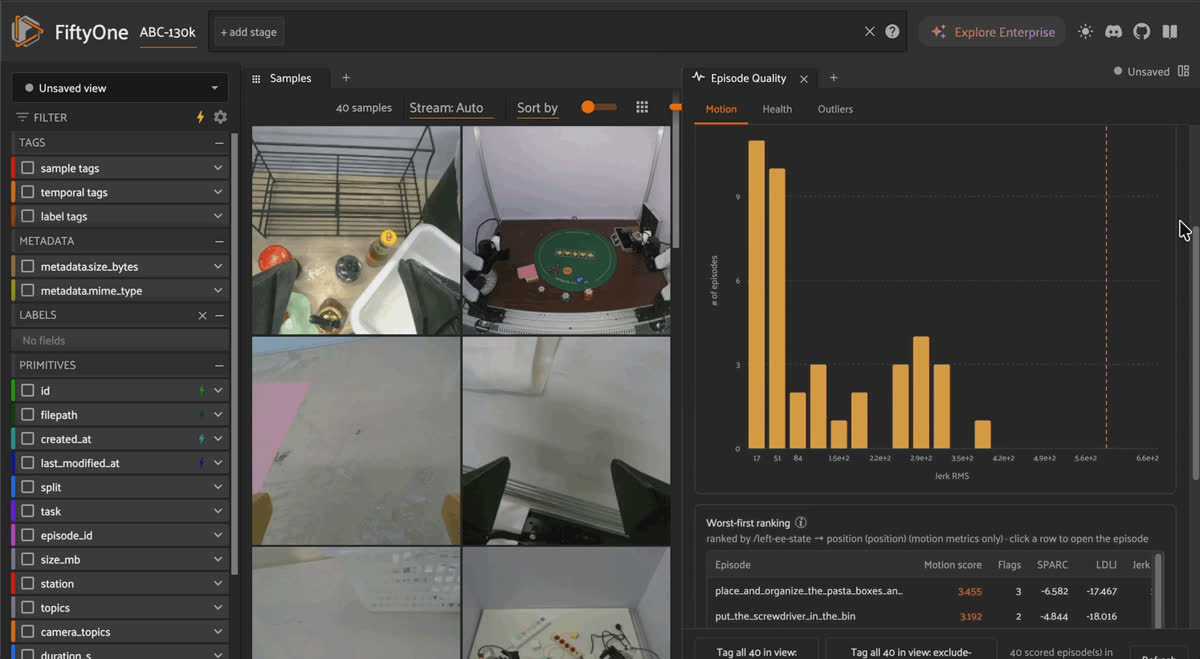
Jerk intensity histogram isolated to the left end-effector signal chip, showing how per-signal distributions differ across the four state channels.
Two things fall out. The arms and the end-effectors are still in different units, so pooling them into one distribution is still arithmetic on incompatible quantities — even though on this corpus their medians happen to land within 30 units of each other. Their spreads are the tell:
/left-ee-state's fitted bad-tail scale (265.51) is nearly 6x /left-arm-state's (44.68), so the same raw jerk deviation that's unremarkable on a gripper is a serious outlier on an arm. Medians alone would have hidden that.The
idle_frac column is the starker illustration. The arms spend most of a window moving (median 0.02-0.09 idle) while the grippers are still for roughly two-thirds of one. A single episode-level idle number would be meaningless; per-signal, it just says grippers hold position, which is what grippers do.So each signal is scored independently, normalized against its own
(metric, signal) stats, then rolled up worst-of: whichever signal has the worst z-score for a metric drives the episode's top-level value. Keep every per-signal number after the rollup. The worst-of value tells a reviewer something's off; the breakdown tells them where.Good to know. Doesn't worst-of just mean one noisy signal decides everything? On ABC-130k it leans that way but doesn't tip over — across 40 episodes,
/right-arm-state drives SPARC's worst-of most often (15 of 40), with the remaining three signals splitting 10/8/7. If one signal won every single time, that would flag a miscalibrated signal, not a broken rollup; leading a plurality without owning a majority is what a healthy rollup looks like.An outlier is not the same as a bad demo
Dataset-relative anomaly detection catches something smoothness misses: an episode whose summary metrics sit far from every other episode's, even when nothing about the motion looks individually rough.
But "outlier" is relative to whatever else is in the batch, and that cuts hard when the batch is diverse. ABC-130k is 40 episodes across 40 different tasks, and both detectors independently rank the same three episodes at the top:
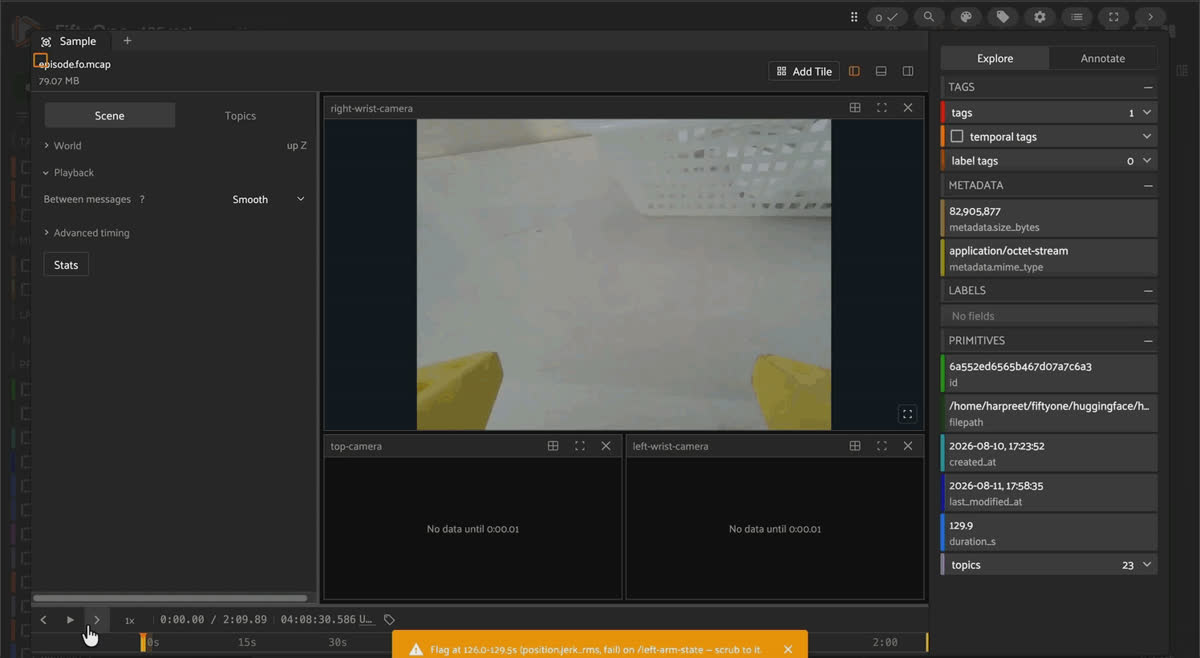
Hovering the fold_the_inside_out_t_shirt point on the outlier scatter, then opening that episode's multimodal viewer with flagged spans on the timeline.
Two of the three are folding tasks. Folding deformable objects is plausibly just more dynamic bimanual work than placing chip bags on a shelf, which is what sits at the clean end of the same ranking. That's not evidence of worse teleoperation. 6 of ABC-130k's 40 episodes clear either model's warn threshold and count as
is_outlier.Run outlier detection over episodes of the same task when you want a clean apples-to-apples read. Across mixed tasks, treat a flag as worth a look, never as probably bad.
Two time scales, two different questions
Every motion metric is computed per window, then summarized per episode two ways: the median across windows (what the episode was typically like) and the worst single window (whether it ever went badly wrong, written as
sparc_worst and friends). You need both. One bad grasp barely moves the median of a 200-second episode, and an episode that's uniformly mediocre never produces a standout worst window.Flagged intervals are a third thing again — windows scored against window-level corpus stats, then merged where they touch. ABC-130k shows how far these can diverge:
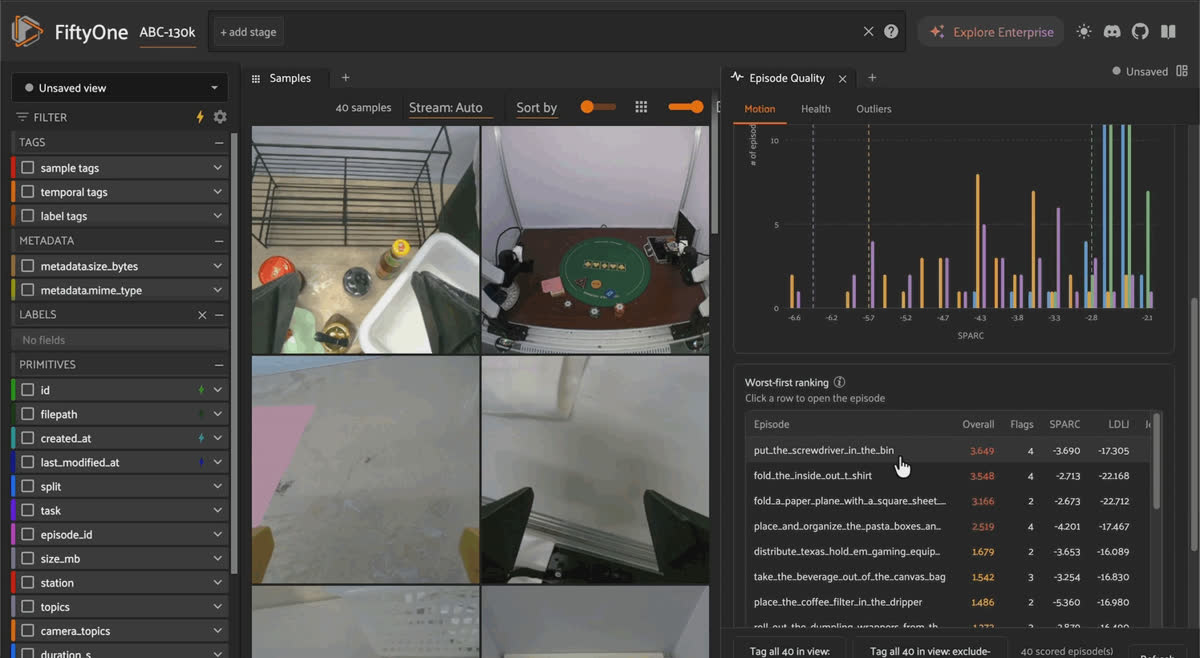
Flagged windows as clickable temporal tag spans on an episode's multimodal timeline beside the wrist and top camera streams.
The worst-scoring episode in the corpus has the fewest flagged spans. Its problem is that it's atypical end to end, not that it contains a few violent moments. The t-shirt episode is the opposite: bad in a lot of specific places. And the cleanest episode by score still carries 10 spans, because "worst 6% of this metric on this signal" is a corpus-relative statement that stays true even in a good episode.
Keep it honest. Those 40 episodes produced 765 flagged spans, a median of 14.5 per episode, with more
warn spans (482) than fail (283). Flag volume is a direct function of how many signals you select: flags are emitted per (signal, metric), and this run selected four signals total, one Position group per *-state channel. /left-arm-state alone carries position, velocity, torque, and pose groups, so selecting more than one per channel multiplies the parallel flag streams accordingly — a deliberate coverage-versus-density trade you make in the picker. Window-level metric distributions still have heavier tails than the normal distribution the z ≥ 3 threshold assumes, so expect fail to keep punching above its nominal weight regardless of how many signals you select.Choosing the parameters
Defaults are fine until a specific dataset proves otherwise. Two knobs matter more than the rest.
Window length (
win_s) sets the resolution-versus-stability trade for everything, and Auto is the default rather than a fixed number: it scans every selected signal across the current view, targets 100 samples at the slowest signal's 10th-percentile rate, floors at 2.0 s, and caches one resolved run-wide value. On ABC-130k that resolves to 3.5 s, comfortably over 100 samples at its ~29.8 Hz signals. Manual override is still there if you want it. Shorter windows localize a flag more precisely but carry less signal: SPARC and the PSD ratio need enough samples to resolve a spectrum, and motion needs at least 5 samples per window at all. On a 1 Hz channel, like oxford-spires-multimodal's transform topic, Auto lengthens the window rather than emitting unscorable partial ones — the run config's short_signal_fraction tells you when a run-wide window is still too long for some signal's stream. Rule of thumb if you go Manual: several times the period of the slowest motion you care about. Consider 5 s for slow rover or AV data, 1 s for fast UAV dynamics.Note that window length changes the episode-level scalars too, not just the flags, since those scalars are the median across windows. And because LDLJ scales with duration cubed, LDLJ values computed at different window lengths aren't comparable to each other at all. Same metric name, different scale.
SPARC cutoff (
fc, default 10 Hz) defines what counts as motion versus noise. Human voluntary movement lives below about 6 Hz, so 10 Hz suits teleop. High-bandwidth platforms like UAV attitude loops and fast pick-and-place have real motion content above it, and leaving fc low makes rough fast motion look artificially smooth. Raise it toward 20 Hz for those. Raising it on slow platforms does the reverse, letting sensor noise into the band so everything reads rougher. SPARC values computed at different fc are not comparable.Overlap (default 0.5) is a pure localization-versus-compute trade; 50% is standard and rarely worth touching. Jerk pre-filter cutoff (default 10 Hz) sets how much high-frequency content survives into the differentiation — lower means smaller jerk values across the board, which is another reason
jerk_rms is within-dataset-relative only. Keep it fixed per dataset. Idle alpha (default 0.05) is the fraction of moving speed that counts as idle; raise it to catch slow creeping, lower it for near-total stillness only.Any parameter change invalidates comparison with previous runs, which is why the config is versioned in the run record.
Which metrics for which job
| You are... | Lead with | Supported by |
|---|---|---|
| Curating teleop demos for imitation or VLA training | SPARC, LDLJ, idle_frac | health, outliers |
| QA-ing an AV log collection | health (desync, dropout, rate stability) | PSD ratio on speed/steering, Isolation Forest |
| Reviewing UAV flights | health (clipping, dropout, drift), PSD ratio | SPARC on angular rates, fc raised |
| Auditing a multi-operator corpus | SPARC distribution, Isolation Forest | idle_frac, knn_dist |
| Publishing a dataset | health, every metric as a distribution report | — |
| Hunting one known-bad moment | interval flags (windowed jerk RMS, SPARC) | temporal tags on the timeline |
The standing rule regardless: metrics rank and flag, your eyes decide.
Running this as a panel: episode quality
The framework above is the design behind Episode Quality, a FiftyOne panel and operator (
demo-quality-scorer) that scores multimodal MCAP episodes worst-first and deep-links every flag into FiftyOne's multimodal timeline.Opening the Episode Quality panel from the panel menu on the ABC-130k teleop dataset in the FiftyOne App.
Step 1: Point it at a multimodal dataset
Load any dataset with
media_type="multimodal" samples. Channels are discovered by shape, meaning message_encoding plus message structure, never by topic or schema name. On ABC-130k's first episode that finds 23 channels and sorts them without a single dataset-specific rule: 3 camera (foxglove.CompressedVideo), 12 telemetry (protobuf RobotState, GripperState, CameraCalibration, and an Instructions string), and 8 flat-JSON scalar_sidecar.Shape-based discovery is the second attempt. A schema-name routing table came first and classified zero channels on this protobuf-encoded data.
Step 2: Run Compute episode quality
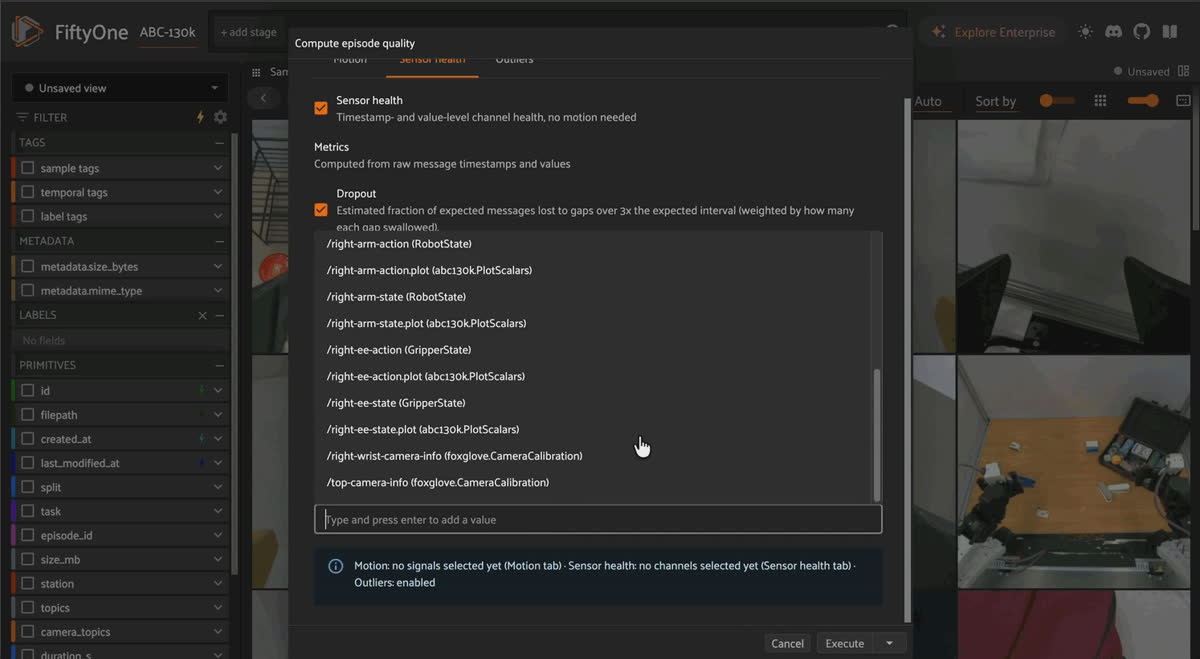
Three independently-toggleable families (Motion smoothness, Sensor health, Outliers), each re-resolved live as you change selections. Motion has Position and Velocity signal pickers at
channel -> field group granularity — you choose exactly which signals count as motion, rather than the plugin guessing from a field-group name. A validation notice above Run states what will and won't compute; it's advisory, never a hard block, so a health-only run on camera-heavy data is a first-class path.The pickers offer every numeric field group a channel exposes, not just the ones that look like motion, which is worth knowing before you start clicking. ABC-130k's
/instruction channel is valid protobuf telemetry carrying a natural-language task string and zero numeric fields, so it never appears as a signal candidate — there's nothing to offer. But its three *-camera-info channels do carry numbers (width, height, and the D/K/P calibration matrices), and those show up as selectable Position/Velocity candidates too, even though they never change across an episode. A constant value can be legitimate motion on some platforms, so the plugin leaves that call to you: leave calibration metadata unselected rather than expecting the picker to filter it out for you.Step 3: Read the Motion tab
Four histograms, one colored series per scored signal, with a worst-first ranking table below. Click a signal in the legend to isolate its series across every chart; click a histogram bar to filter the samples grid to exactly the episodes in that bin. Hovering a metric cell in the table gives the per-signal breakdown behind the worst-of value.
Step 4: Read the Health tab
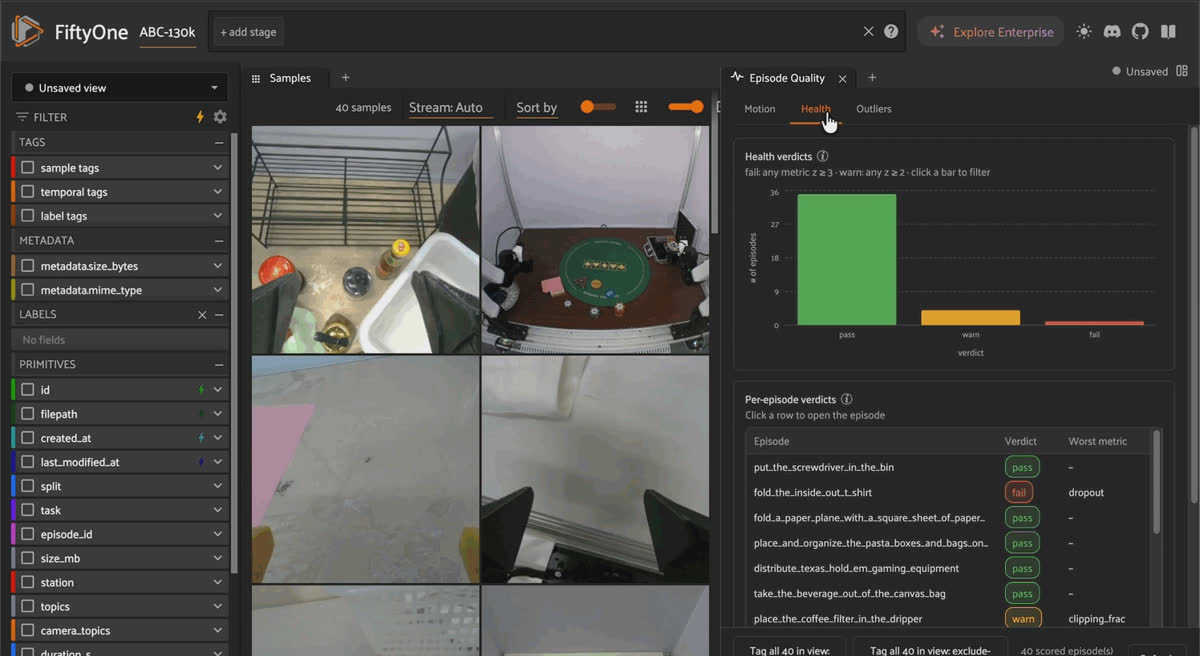
A pass/warn/fail bar chart plus a per-episode table where every non-pass verdict names its worst-offending metric, so a fail tells you what to check first. A verdict is fail if any health metric's z-score hits 3, warn if any hits 2, else pass. Health rolls up worst-of across channels, same as motion — one bad channel is enough to flag the episode, so a fail here can come from a single misbehaving sensor even if every other channel is pristine.
ABC-130k illustrates both halves of that. Dropout and desync are clean across the board — 0.00 median dropout, worst-pair desync under 0.17 ms — and clock drift reads unavailable on every episode because the recorder writes one clock twice. Clipping isn't clean: the arm channels stay under 2%, but the gripper channels are pinned near their open/closed limits often enough to push the worst-of
clipping_frac past 80% on one episode. 35 of 40 episodes still come back pass, 4 land on warn, and ABC-130k's single fail is fold_the_inside_out_t_shirt, blamed on health.dropout — its one real dropout gap outranks every gripper's clipping on that episode. Health verdicts on near-degenerate metrics like dropout are driven by the tail of a near-degenerate distribution: when a metric reads exactly zero for almost every episode, the scale is set so a typical member of the nonzero tail lands on the warn threshold, which means being in the tail at all earns a glance.Step 5: Read the Outliers tab
A scatter of
iforest_score against knn_dist, one point per episode, with points clearing either warn threshold in red — 6 of ABC-130k's 40. Click a point for the same deep-link as the other tabs.Step 6: Confirm by eye, then tag
Click any row to jump into that episode's multimodal viewer. Every flagged window is a real, clickable temporal-tag span on the player's timeline (
"<channel>:<group>.<metric>:<severity>", e.g. /left-arm-state:position.jerk_rms:fail), so you scrub straight to the flagged interval instead of hunting through 200 seconds of video. Once you've confirmed what you're looking at, two bulk-tag buttons apply review or exclude-candidate to your selection, or the whole view if nothing's selected.These are plain FiftyOne sample tags, which is deliberate —
exclude-candidate stays a view you build later with dataset.match_tags("exclude-candidate", bool=False), not a filter that already ran and threw data away.Try it yourself
- Plugin repo: github.com/harpreetsahota204/demo_quality_scorer
- Dataset: Voxel51/ABC-130k on Hugging Face
- FiftyOne docs: docs.voxel51.com
Frequently Asked Questions
compute_episode_quality auto-unchecks Motion smoothness with a visible reason, since no channel carries a speed-derivable numeric signal. The Sensor health picker won't offer camera channels either — the health formulas are timestamp-only and would work fine on them, but the decode path has no lightweight timestamp-only read yet. Outliers still fit on whatever health metrics exist, weaker without motion features.
No. n_flags counts how many metrics cleared z ≥ 2, so it tells you how many independent signals think something's off, not that the episode is bad. Open it, check the quality_intervals (each carries channel, metric, start, end, value, severity), and decide from what you see.
You can compare the shape of the math, not the scale. That anchor comes from human point-to-point reaching studies; ABC-130k's bimanual teleop medians -2.92, and a UAV's angular rates would land somewhere else again. What transfers is the ordering within one corpus scored under one config.
Because field names aren't a reliable signal of what's actually motion. A camera calibration channel's D/K/P matrices and a joint's covariance block are both numeric and would happily get scored as position or velocity on nothing but shape; a real velocity field with an unhelpful name would be just as easy to miss going the other way. Picking channel -> field group pairs explicitly costs one click per signal and guarantees only the motion you actually mean gets scored.
Because the recorder almost certainly wrote one clock twice. The metric needs publish_time and log_time to be genuinely distinct sources; when they're identical, every offset is zero and the honest answer is unavailable rather than a suspiciously perfect 0.0. All 40 ABC-130k episodes report unavailable, and so does every other multimodal corpus tested against the plugin so far.
Every sample carries quality.config_version. If a formula or parameter changes, old and new scores aren't comparable, so the panel flags a mixed-version view instead of silently ranking across two different definitions of the same number. Re-run the scorer across the whole view to make it comparable again.
overall_score is a weighted blend of every enabled metric's robust z-score, motion and health and outliers together, oriented so higher is worse. It's the sort key for the ranking tables. is_outlier is narrower: True only if the Isolation Forest or kNN score individually clears its own warn threshold. An episode can carry a middling overall_score and still be is_outlier if it's anomalous relative to the batch without being uniformly bad on any one family.
Hacker-in-Residence
Harpreet is Hacker-in-Residence at Voxel51, where he turns cutting-edge AI ideas into open-source prototypes and demos that push the boundaries of deep learning. From building tools that inspire to creating content that educates, Harpreet helps the AI community level up—one wild idea at a time.
See all articles by Harpreet Sahota
Talk to an AI expert
Loading related posts...
© 2026 Voxel51 All Rights Reserved


