In this article
What our 2026 survey tells us about visual and physical AIKey findingsVisual and physical AI are inherently multimodalVisual and physical AI deliver value, but investment lags behind the opportunityModel failures are ubiquitous,
and the causes trace back to dataData work is the bottleneck, not data collectionAnnotation is expensive, wasteful, and painfulFinal thoughts on the state of visual and physical AISurvey methodology and participant demographics
Talk to an AI expert
What our 2026 survey tells us about visual and physical AI
The last decade of AI progress was built on text. Billions of documents, books, web pages, and conversations were scraped and fed into models until language became commoditized. As text data yields increasingly incremental returns, the frontier has shifted toward data in the physical world.
Video, sensor streams, LiDAR point clouds, time series from industrial equipment, satellite imagery, medical scans, and other high-dimensional multimodal data carry enormous untapped potential. This is the visual layer that physical AI is built on — the perception channel through which machines see, reason, and act in the physical space. But much of this data sits locked inside enterprises that have spent years accumulating it without the infrastructure to make it usable.
Physical AI is where the hardest problems are, and where the most important work will be done. It's also new territory in the truest sense: as of 2026, there are no established benchmarks, no standardized infrastructure, and no consensus on what good looks like at each stage of the pipeline.
This report, conducted by Dimensional Research and commissioned by Voxel51, draws on a 2026 online survey of over 700 professionals working at the intersection of visual AI and the physical world. It documents how teams are actually building physical AI — so practitioners can benchmark their own work, and leaders can invest in the capabilities that will define the next decade of AI. Where relevant, data is broken out by team maturity and deployment stage so readers can locate their own work within the broader field — or use the Physical AI Pipeline Audit to get a quick read on where they stand.
Key findings
Visual and physical AI are inherently multimodal
- 68% of visual and physical AI teams work across three or more data modalities, with top physical AI applications including tracking, 3D reconstruction, pose estimation, and VLA models
- 92% expect world models and spatial intelligence to break into mainstream awareness
Value is proven, but investment lags behind the opportunity
- 78% of teams are already seeing value from their visual and physical AI investments, and 86% expect its importance to grow over the next three years
- Yet 74% say the industry is underinvested
Model failures are ubiquitous, and the causes trace back to data
- 100% report underperforming models
- The top five causes of model failures are all data issues: insufficient training data (57%), data quality problems (48%), domain shifts (43%), annotation errors (32%), and class imbalance (31%)
- 95% say human involvement is regularly required throughout model development, with 67% diagnosing failures through manual review
Data work is the bottleneck, not data collection
- 89% say data is the primary driver of visual and physical AI success
- 97% struggle to iterate on datasets, with the top pain points including bad labels (59%), difficulty in identifying samples hurting model performance (47%), and coverage gaps (43%)
- 58% of exceptional teams spend more than half their project time on data work, compared to just 21% of struggling teams — a nearly 3x gap
- 63% agree that synthetic data will become the primary source of training data
Annotation is expensive, wasteful, and painful
- 99% of teams describe their annotation process as painful, and only 34% are satisfied with it
- 36% report that more than half of their annotated data never reaches production
- 44% expect annotation costs will increase in the coming year
Visual and physical AI are inherently multimodal
Physical AI — the ability to combine images, video, 3D, sensor, and time-series data into unified systems that perceive and reason — is no longer an experimental pursuit. It's how teams are building today.
Images dominate the field at 92%, and video is nearly as widespread at 63%. But practitioners are working with far more than 2D frames.
Time-series data from inertial measurement units (IMUs) and sensors (42%), 3D point clouds, meshes, and LiDAR (38%), audio (25%), and multispectral imagery (18%) are all active parts of workflows today.
Moreover, most teams aren't specializing in one data type — they're fusing several. Physical AI is inherently multimodal, with 68% working across three or more modalities, and only 6% work with just one.


68% work across three or more modalities
The infrastructure and tooling required to support physical AI at scale — multimodal data management, 3D visualization, sensor fusion — is still catching up to practitioner intent. For teams moving toward physical AI, building fluency with these data modalities now is one of the highest-leverage investments available.
References to "visual AI" throughout this report encompass the full range of data modalities surveyed — images, video, time-series and sensor data, 3D point clouds and LiDAR, audio, and multispectral imagery
Physical AI is moving beyond 2D perception into spatial and embodied systems
Applications of these data modalities span a wide range of maturity. Object detection and classification remain the dominant use cases at 62% and 61%, respectively, reflecting the mature foundation of visual AI.
But one cluster of applications — vision-language-action models for robotics (20%), 3D reconstruction and world models (27%), pose estimation and keypoint detection (25%), and tracking (40%), alongside the growing use of time-series and 3D sensor data — points to a distinct frontier: systems that don't just interpret visual data but act on it in the physical world.

The write-in responses further underscore how broadly physical AI has already taken root. Teams reported working on seismic auto-interpretation, hyperspectral imaging, stereo depth estimation, and autonomous navigation — applications spanning energy, defense, agriculture, and logistics.
"It started with perception AI. Then generative AI. Now, we're entering the era of physical AI." – Jensen Huang, CEO, NVIDIA
Practitioners are clear-eyed about where the field is headed: 92% agree that world models and spatial intelligence will break into mainstream awareness in the near future.
Optimism extends to what physical AI systems will ultimately be capable of. 95% of practitioners believe AI will eventually replicate human performance across perceptual tasks.
92% agree that world models and spatial intelligence represent the next frontier in visual AI and will break into mainstream awareness in the near future.
95% believe AI will reliably replicate human performance
They’re largely aligned on which industries will get there first — autonomous vehicles, manufacturing, and security and surveillance lead the ranking, while healthcare, defense, and aerospace sit near the bottom, likely reflecting the regulatory complexity on the path to real-world deployment.

Visual and physical AI deliver value, but investment lags behind the opportunity
The business case is clear. 78% of teams are already seeing value from their visual AI investments and 86% expect its importance to grow over the next three years. Leadership skepticism is exceedingly rare with only 6% reporting that leadership is questioning the investment at all.


”I am optimistic about the potential of visual AI to revolutionize real-world decision-making. I eagerly anticipate the development of more transparent, explainable, and ethically designed systems in the future.” – Survey respondent working as a Data Scientist in the United States
What isn't settled is the level of investment required to realize that value. 74% of practitioners say the industry is underinvested, and only 34% of deployments have reached production. The rest remain in pre-production, prototyping, or early research.


“It still requires a lot of experience and know-how to deliver visual AI solutions from inception to production.” – Survey respondent working as an AI/ML Engineer in Europe
The barriers to investment are real but largely temporary. Attention is elsewhere (63% cite GenAI hype absorbing budget), the technology is seen as early (45% view world models and embodied AI as research rather than product-ready), and use cases are still coming into focus (45%). None of these are permanent conditions — they're the natural friction of an emerging field finding its footing, and every one of them will resolve as the category matures.

The organizations investing now will have the data infrastructure, tooling maturity, and institutional knowledge to move fast when the broader market catches up. Which raises the harder question the rest of this report addresses: why, despite proven value and broad commitment, does progress stall? The answer, consistently, comes back to data.
Model failures are ubiquitous, and the causes trace back to data
The top five causes of model failure are all data problems
Issues with model performance and failure are a fact of life for visual and physical AI teams. Every single participant in this study (100%) indicated that they had experienced underperforming models. For a third (34%), these issues are persistent. Even the most mature teams aren't immune. Among organizations with models in production, 76% say model failures are common.

Top causes of model failures
Data issues account for all of the top causes of model failures. This includes:
- Insufficient training data (57%)
- Quality issues such as occlusions or artifacts (48%)
- Domain shifts between training data and real-world data (43%)
- Data annotation errors or inconsistencies (32%)
- Class imbalance in training data (31%).

100% say their models underperform
Training process issues like overfitting (24%) and model architecture limitations (19%) also factor in but rank lower. Perhaps most striking: some teams couldn't answer the question at all, writing in that their models are black boxes and the root cause is simply unknown.
”In our experience the hard part isn’t building the model, it’s keeping it reliable in real factory conditions. Data quality and maintenance matter more than chasing bigger architectures.” – Survey respondent working as an AI/ML Engineer in manufacturing
These failure modes are especially costly in physical AI deployments, where a domain shift between training data and real-world sensor conditions, or an unlabeled edge case, can translate directly into a robot, vehicle, or inspection system failing in the field.
If every model failure traces back to data, then the question is why data work is so hard. The rest of this report looks at where teams actually lose ground.
Humans are heavily involved in model development, especially for troubleshooting
Despite advances in automation, human involvement in model development remains extensive. Participants were asked to characterize the degree of human involvement in their workflow, and the data is unambiguous.
95% say human involvement is regularly required throughout model development. Even among the most mature teams with models in production, that figure shifts only marginally, with 9% reporting minimal involvement. The vast majority report extensive (19%), significant (53%), or moderate (23%) human participation. The numbers tell a consistent story across every maturity level: automation has not displaced human judgment but redistributed it.

We also see a need for humans in the process of troubleshooting underperforming models. When asked about the process taken to diagnose issues, the top approach by far was manual review of failures (67%).

Data work is the bottleneck, not data collection
If data problems cause the majority of model failures, then the real question is why data work is so hard to get right. The answer isn't collection — teams have plenty of data. It's what happens after: how that data is curated, managed, and validated against real-world performance. This is where progress stalls.
The vast majority of practitioners (89%) agree: as models and compute become commodities, data is now the primary driver of visual and physical AI success.
89% say with models and compute being commoditized, data is now the primary driver
of visual and physical AI success
Dataset iteration is a universal pain point and physical AI makes it worse
97% of teams report that they face dataset iteration challenges. In physical AI, these visibility gaps tend to multiply. The issues cluster around a common theme: lack of visibility.
Teams struggle to identify bad labels (59%), pinpoint which samples are hurting model performance (47%), and detect gaps in coverage (43%) before they become production problems. The result is a reactive workflow that is heavy on data rework, a problem that only compounds as datasets grow.

Dataset challenges don't diminish with experience. Among teams with models in production, 99% report dataset challenges, compared to 96% of teams still in the research phase. While some friction points ease over time, annotation rework actually gets worse: 66% of production teams cite it as a top challenge, versus 56% of teams still in research. Maturity brings scale, and scale makes data quality harder to ignore. The Physical AI Pipeline Audit benchmarks where your team stands against 700+ practitioners in this study.
"Competitive advantage in AI goes not so much to those with data but those with a data engine: iterated data acquisition, re-training, evaluation, deployment, telemetry. And whoever can spin it up fastest." – Andrej Karpathy, founding member of OpenAI and former Director of AI at Tesla
In physical AI, dataset iteration compounds further. A single training run might draw on video, LiDAR, time-series sensor data, and 3D point clouds — each with its own labeling conventions, failure modes, and coverage gaps. A bad label in a 2D bounding box is one problem; a misaligned LiDAR return, a dropped IMU reading, or a temporal gap across synchronized streams is another class of problem entirely.
Teams aren't just iterating on more data — they're iterating across more kinds of data, and the visibility gaps multiply with every modality added to the stack.
The teams that ship successfully spend more time on data
It's no surprise that data work consumes a significant share of project time. Across all project types, a third of teams (34%) spend more than half their time on exploration, curation, cleaning, and quality checks.
But time spent on data isn't a cost — it separates the teams that ship successfully from the ones that stall.
Among self-described exceptional teams, 58% spend more than half their project time on data work. Among struggling teams, just 21% do, a nearly 3x gap. The pattern holds across every tier: the better teams rate their own track record, the more of their time goes into data. If you’re wondering where your team sits, take the Physical AI Pipeline Audit that benchmarks your data practices against the 700+ practitioners in this study.

"80% of AI is the dirty work of data engineering." — RAND National Security Research Division
Training datasets are getting bigger, more proprietary, and more industry-specific
Training datasets for a project can easily include millions of data points— both labeled and unlabeled data. Across our entire study, almost a quarter (23%) reported over a million data points per project, including 3% that have over one billion.
"A four-year-old child has seen 50x more information than the biggest LLMs that we have." — Yann LeCun, Chief AI Scientist, Meta
Dataset size varies significantly by industry. Individuals working on autonomous vehicles are among the most data-intensive, with 47% reporting more than one million data points per project. Manufacturing sits at the opposite end — 31% have fewer than 1,000 data points per project. Often, this reflects the more controlled and constrained environments in which manufacturing systems operate.

In addition to variation by industry, we see that the size of datasets grows with maturity. Companies whose models have been deployed to production are more likely to have project datasets with more than 10,000 data points (70%) compared to organizations at the research stage (43%).

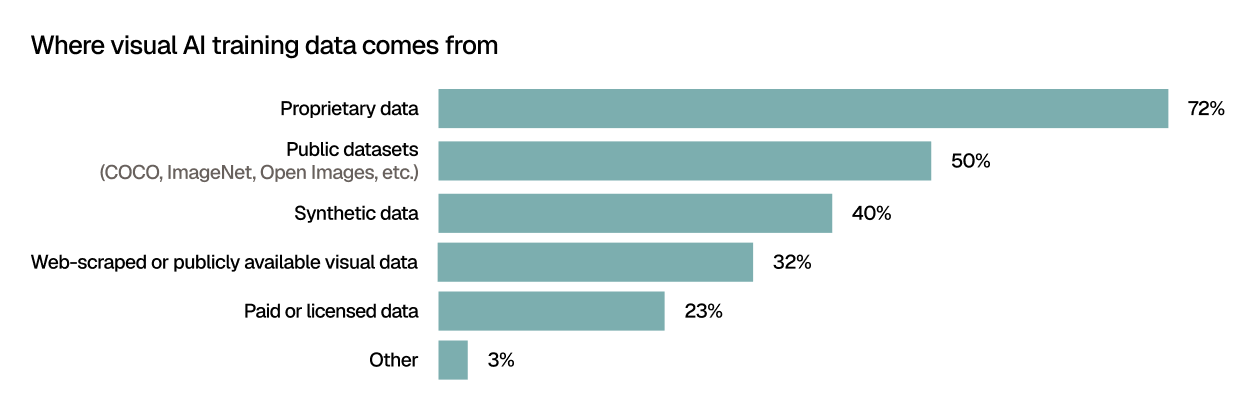
Larger datasets generally produce more reliable models — provided quality keeps pace with volume. In pursuit of more training data, organizations are drawing from multiple sources simultaneously.
91% of teams in production use proprietary data to train visual AI
Proprietary data remains the foundation, with 72% citing it as a source of training data — a number that climbs to 91% among teams with models in production, up from 59% at the research stage.
The pattern suggests that public datasets serve as a starting point for experimentation, but as teams mature and models move closer to real-world deployment, proprietary data becomes the dominant source.
This concentration has significant downstream implications: unlike public datasets (used by 50% of teams for training data), proprietary data requires organizations to build or acquire the infrastructure to store, curate, label, and continuously validate it at scale.
Synthetic data unlocks the edge cases that real-world data misses
Coverage gaps were one of the top-cited dataset iteration challenges (43%), and synthetic data is how a growing share of teams expect to close them.
63% believe synthetic data will be
the primary source of training data
While only 40% use synthetic data today, 63% believe it will become the primary source of training data for their projects in the near future — a significant gap between current practice and where practitioners expect the field to land.
Synthetic data — digitally generated images, video, and sensor outputs that simulate real-world conditions — offers something real-world data collection cannot: the ability to produce diverse, labeled examples on demand. This allows developers to test systems against a wide range of scenarios, including edge cases that rarely appear in real-world datasets.
Annotation is expensive, wasteful, and painful
Teams need less labeled data each year
The landscape for training data is shifting rapidly, and two signals stand out the most. More than half (57%) expect to need less labeled data each year to achieve the same model performance, suggesting that efficiency gains are outpacing data volume requirements. And 68% believe vision-language model growth will soon stall as available training data runs out — a challenge already playing out in LLM development.
57% expect to need less labeled data each year to achieve the same model performance
68% believe vision-language model growth will soon stall as available training data runs out
Annotation is expensive, wasteful, and painful
Data annotation — the process of labeling raw images and video so models can learn to recognize patterns, objects, and actions — is foundational to AI. The quality and consistency of those labels directly determine what a model learns and how well it performs in the real world.
Nearly all teams (96%) label their own data rather than relying on pre-labeled datasets. Most teams keep labeling in-house (65%), increasingly augmented by model-assisted labeling (51%). This mix represents both the sensitivity of proprietary data and the growing maturity of annotation tooling.

Approaches to labeling also vary by industry. Teams working with autonomous vehicles and driving were more likely to report using model-assisted labeling (67%), while healthcare and medical technology companies were more likely to say they leveraged subject matter experts (59%).
“It's literally me by hand on the weekend cranking through data!” – Survey respondent working as a software Engineer in retail
Despite the proliferation of external annotation vendors, only 27% of teams use outside services. But adoption grows with organizational size.
Among organizations with 10,000+ employees, 37% rely on external annotation services. Similarly, among projects with more than a million data points, that share rises to 41%. This likely reflects both a willingness to pay for services and the practical reality that larger, more complex projects demand external resources.

Given the effort and cost required to annotate data, it is not surprising that teams are gaining experience with model-assisted labeling as their projects mature. Companies in production are almost twice as likely to use model-assisted labeling (70%) compared to those in the research phase (37%).

Teams label too much of the wrong data
Data annotation has a significant operational cost, particularly when done manually by internal teams or subject matter experts. Despite the investment, more than a third (36%) report that less than half their annotated data ever reaches production, with 15% saying less than a quarter makes it through.

The financial impact compounds quickly in physical AI. At a conservative $1.50 per sensor-fused 3D cuboid, annotating one million objects costs $1.5M. When 50% of that data never reaches production, you’re looking at $750,000 in sunk costs. In reality, a single second of driving data can contain dozens of objects across synchronized streams, meaning teams are spending thousands of dollars on single sequences that may ultimately be discarded.
Without the ability to identify high-value samples before annotation begins, teams default to labeling everything and discarding what doesn't make the cut. The waste isn't an annotation problem. It's a data curation problem.
Existing annotation processes are painful
Teams are frequently unhappy with their approach to annotating data. Only a third (34%) report they are satisfied with their annotation process, a very low number considering how important this effort is to visual AI outcomes. This number is even lower among data scientists (22%) and individuals working at manufacturing companies (25%). While annotation pain is nearly universal in this data, it's not evenly distributed. See where your process stands by taking the Physical AI Pipeline Audit.

99% say annotation process is painful
The dissatisfaction is nearly universal, with 99% describing their annotation process as painful. Cost and speed top the list (65%), but two deeper issues stand out: teams struggle to identify which samples are worth labeling in the first place (46%), and when they do label, quality and consistency are difficult to maintain (58%). Too much of the wrong data gets labeled, and too much of the right data gets labeled incorrectly.

Investments in annotation are expected to grow
For most teams (78%), annotation spend is stable or growing — 44% anticipate an increase, 34% expect it to hold steady. Only 22% project a decrease.

AI-assisted automation (auto-labeling, foundation models, synthetic data) is the #1 reason teams expect annotation costs to fall, and the #3 reason they expect costs to rise. Scope changes (#1) and budget or resourcing shifts (#2) round out the reasons for cost increases, but automation is the only factor showing up prominently in both directions.

Physical AI still demands custom model development
The model development landscape reflects an industry still finding its footing, and a domain where foundation models haven't yet taken hold the way they have in language. Fine-tuning publicly available models dominates at 72%, but the more telling finding is that 57% of teams are still training custom models from scratch. Only 29% use models off-the-shelf without any modification.
This pattern is specific to visual and physical AI. Foundation models are trained overwhelmingly on internet text and 2D images. They've seen very little LiDAR, few synchronized multi-camera rigs, almost no IMU or industrial sensor streams, and none of the domain-specific edge cases that define real-world deployments.
Fine-tuning and post-training can close some of that gap, and for many teams, they do. But when 57% still conclude it isn't enough and build from scratch, it's a signal that off-the-shelf capabilities have real limits in production physical AI deployments.
For teams evaluating what purpose-built infrastructure should actually include, check out the 2026 Physical AI Data Platform Guide.

Final thoughts on the state of visual and physical AI
Physical AI is scaling fast. Robotics, autonomous systems, and industrial applications are moving from pilots into production, and the amount of data generated is measured in petabytes, not gigabytes.
The companies that win this decade will be the ones that treat their data stack as core to their physical AI strategy – on par with investments in models and compute – not as a downstream cost. As models become increasingly commoditized, the ability to find, curate, and act on the right data becomes the primary driver of model performance.
"What enables each wave and each phase of AI, three fundamental matters are involved. The first is how do you solve the data problem." — Jensen Huang, CEO, NVIDIA
The data challenges in physical AI are distinct, and they compound at scale:
- Multimodal complexity emerges across inputs. Camera, LiDAR, radar, and depth streams have to be synchronized and spatially aligned before they can be analyzed together — a problem that doesn’t exist in text or tabular ML.
- Value concentrates in a fraction of the data. System safety depends on rare edge cases such as unusual pedestrian poses, lighting conditions, or manufacturing defects that are difficult to find in petabyte-scale datasets.
- Data quality degrades at scale. As datasets grow, errors accumulate across labels, sensors, and distribution shifts, turning isolated mistakes into widespread quality issues hidden throughout the data.
- Annotation spend is wasted on low-value data. Teams pay to label large volumes of data, even when additional samples provide no meaningful signal once common patterns have already been learned.
- Aggregate metrics misrepresent real-world performance. Metrics like mAP and IoU guide training, but fail under real-world conditions where edge cases, long-tail events, and safety-critical scenarios determine performance.
- Traceability breaks down in production. When models fail, most stacks cannot reliably connect failures back to specific data, labels, or training runs.
What teams should look for in a physical AI data platform:
- Unified view across sensors. Infrastructure that ingests and visualizes camera, LiDAR, radar, and depth data in a single interface, with synchronization and alignment handled as a property of the data layer rather than a per-project engineering project. Engineers need to debug fusion failures where they actually occur — across modalities, in the same view.
- Scenario mining at petabyte scale. The ability to surface rare, high-value moments from massive archives using semantic search, similarity, and metadata filtering — without manual review. Edge cases can't improve model performance if teams can't find them.
- Continuous, multi-dimensional quality workflows. Tooling that detects annotation errors, flags sensor anomalies, and identifies coverage gaps and distribution drift as first-class signals. Quality has to be monitored continuously across dimensions, not audited once at handoff.
- Curation that targets what the model is weakest on. The ability to identify underrepresented classes, low-confidence predictions, and failure clusters, then prioritize annotation spend against them. Annotation budgets should reinforce where models fail, not where data is easiest to collect.
- Scenario-based, sliced evaluation. Per-condition, per-class, per-geography performance breakdowns that go beyond aggregate metrics. Teams need to know where a model fails before deployment tells them — and regulators increasingly require it.
- Dataset and model lineage. Every prediction, label, and model version traceable back to the exact data that produced it. When a failure surfaces in production, teams need to connect it to the training examples, annotation revisions, and model run that caused it — not guess.
Not sure where your data practice stands relative to the field? Take a few minutes to find out.
Physical AI Pipeline Audit →
Model accuracy, robustness, and deployability are downstream of how well a team can see into its data and act on what it finds. The organizations that close that loop fastest will ship physical AI systems that work in production. The ones that do not will watch their programs stall in the accuracy gap between demo and deployment. Check out the full detailed breakdown of what to evaluate: 2026 Physical AI Data Platform Guide.
Survey methodology and participant demographics
This research was conducted by Dimensional Research and commissioned by Voxel51. An online survey was sent to independent databases of professionals working in physical AI, visual AI, and computer vision. A total of 709 qualified individuals participated in the survey. All participants had professional experience working with visual or multimodal data. Participants included a mix of roles, responsibilities, company sizes, industries, and regions. Responses were captured in 2026. Due to rounding, certain graph options may not add up to exactly 100%.


About Dimensional Research
Dimensional Research® provides practical market research for technology companies. We partner with our clients to deliver actionable information that reduces risks, increases customer satisfaction, and grows the business. Our researchers are experts in the applications, devices, and infrastructure used by modern businesses and their customers.
For more information, visit www.dimensionalresearch.com.
About Voxel51
Voxel51 is the leading data platform for physical AI. The company's flagship product, FiftyOne, combines open-source flexibility with enterprise-grade capabilities to help teams understand and analyze their multimodal data, annotate the right samples, close quality and coverage gaps, and build models that perform reliably in the real world. Trusted by millions of developers and thousands of enterprises—including Porsche, Vivint, Berkshire Grey, and Microsoft—FiftyOne is how the world's leading AI teams build the data foundation physical AI demands. Learn more at voxel51.com.
© 2026 Voxel51 All Rights Reserved