Voxel51 for VLA Development: Visualize, Query, and Curate Multimodal Data
Author

Machine Learning Engineer
Passionate about Artificial Intelligence, Entrepreneurship and the intersection of the two.
See all articles by Prerna Dhareshwar
In this article
In this article
Try Voxel51 for yourself
Updated 9/10/2026: FiftyOne Enterprise is now called Voxel51. Voxel51 now natively supports Hugging Face LeRobot datasets alongside MCAP. You can now ingest, visualize, and curate open-source robotics datasets directly within Voxel51.
Every team building autonomous systems eventually hits the same wall. The robot dropped the part. The vehicle disengaged for a shadow. The manipulator misidentified an object it successfully grasped a hundred times before.
Visualization tools can help you see what happened. What they can't do is tell you whether it's an isolated incident or a widespread failure mode hiding in your dataset. To systematically improve models — whether you’re curating core datasets to boost generalization or running longtail investigations — you need to understand the full scope of the problem.
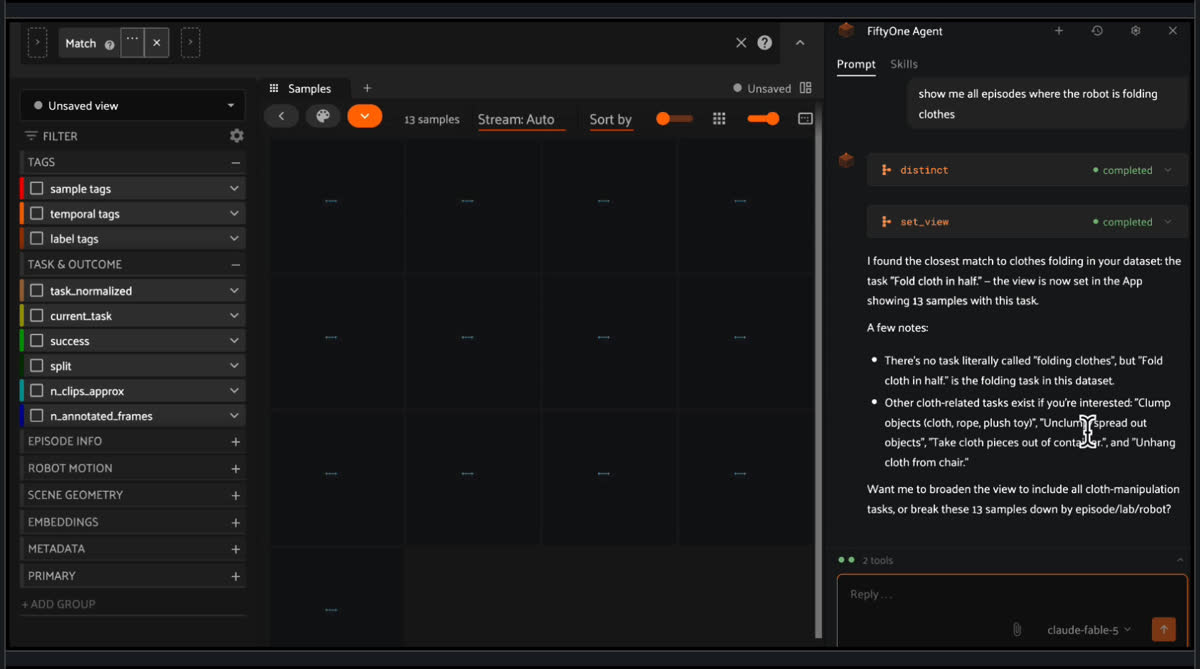
Today, we're introducing multimodal time-series data support in Voxel51. Teams building end-to-end (E2E) and vision-language-action (VLA) models can now visualize, query, and curate synchronized multimodal episodes from a single platform.
Key takeaways
- Voxel51 now supports multimodal time-series data. Visualization, data curation, and annotation are unified in a single platform for physical AI.
- Native MCAP ingestion with synchronized playback. Camera, LiDAR, and numeric sensor streams play back in sync on a shared timeline, with no lossy pre-extraction pipelines.
- Complex time-series data becomes fully searchable. Query and filter by metadata, temporal events, and labels, or use embedding-based search to discover similar behaviors and patterns across the dataset.
- Labels persist as tracks across a full episode. Scrub the timeline to see when an object appears or an event unfolds across the episode.
- Curate data with temporal tags. Tag arbitrary intervals within episodes and turn them into persistent, metadata-rich, queryable assets for any curation workflow.
- Available today in FiftyOne Open Source and Voxel51. The ability to query multimodal data and label tracks are Enterprise-only features.
The VLA paradigm: better generalization, black box debugging
Physical AI is shifting from modular pipelines to end-to-end architectures, especially vision-language-action models. Instead of separate perception, planning, and control systems, a single model takes all sensor data as inputs and outputs the physical action.
This shift delivers clear advantages. By leveraging large foundational models, VLAs generalize better, adapt more easily to new tasks, and require far less task-specific data — a significant benefit in robotics, where collecting demonstrations is expensive and time-consuming.
The tradeoff is observability. As models become more capable, they also become harder to interpret. The intermediate signals engineers once relied on disappear, leaving data as the primary way to understand model behavior.
| Modular pipeline | End-to-end/VLA | |
|---|---|---|
| Architecture | Separate modules used for perception, localization, prediction, planning, and control | A single model maps raw sensor inputs directly to actions |
| Performance | Modules are optimized independently, which can leave whole-system performance on the table | Optimized holistically, with better generalization and more fluid behavior |
| Interpretability & Debugging | Inspectable outputs present at every stage, so errors can be isolated to a specific module | Black box with no intermediate signals, so failures must be traced through the training data |
| Data requirements | Each module is trained or engineered on its own narrower data, such as labeled images for perception, with no need for full task demonstrations | Requires vast, diverse datasets covering rare scenarios and conditions |
| Key failure risk | Error propagation, where a mistake in one module cascades downstream | Poor generalization to situations underrepresented in training data |
Modern VLA models increasingly rely on chain-of-thought reasoning, where behavior emerges from interpreting observations in the context of goals, prior state, and the surrounding environment. Diagnosing these complex failures requires an equally sophisticated approach to data that lets teams trace emergent behavior back to the underlying training data.
Visualization doesn’t solve the data curation bottleneck in physical AI
Building models for the physical world requires finding the data that explains underlying model behavior. That challenge looks very different across domains. In autonomous vehicles, it means finding rare edge-case failures hidden in a haystack of millions of nearly identical driving sequences. In robotics, it means identifying gaps in demonstration coverage within a limited dataset.
In both cases, traditional visualization tools only scratch the surface. They make it easy to inspect a single, isolated event. If a vehicle disengages because of a blinding sunset, or a robotic arm misses a grasp due to a strange reflection, it's straightforward to replay the episode and see what happened.
The harder problem is determining whether a specific event is a one-off anomaly or evidence of a broader pattern hidden in your dataset. How that investigation unfolds depends on where you are in the VLA development lifecycle:
- For AV teams, scale is the problem. Fleets generate petabytes of largely redundant driving data, so a single sunset failure means finding every similar failure hiding in a haystack of near-identical clips.
- For robotics and manipulation teams, data scarcity is the problem. Demonstrations are slow and expensive to collect, so the goal is identifying where coverage is insufficient and what demonstrations to collect next.
Both are ultimately data curation problems, and today there are few purpose-built tools for querying multimodal data. Most teams still rely on custom scripts and ad hoc workflows to search raw data lakes for related examples.
This tooling gap leaves the visualization workflow completely siloed from the dataset workflow. When a new failure mode surfaces in triage, the path to finding every other time it occurred becomes an hours-long excavation rather than a simple query.
Physical AI development shouldn't require stitching together playback tools, custom ETL pipelines, SQL queries, and annotation platforms. Yet that's how many teams work today. Visualization, dataset retrieval, curation, and annotation all happen in separate systems, forcing engineers to constantly switch contexts and move data between disconnected tools. Instead of a continuous data flywheel, every investigation starts from scratch.
Bringing world-class data curation for multimodal data in Voxel51
Multimodal data support in Voxel51 unifies visualization, data curation, and annotation into an end-to-end data platform for physical AI.
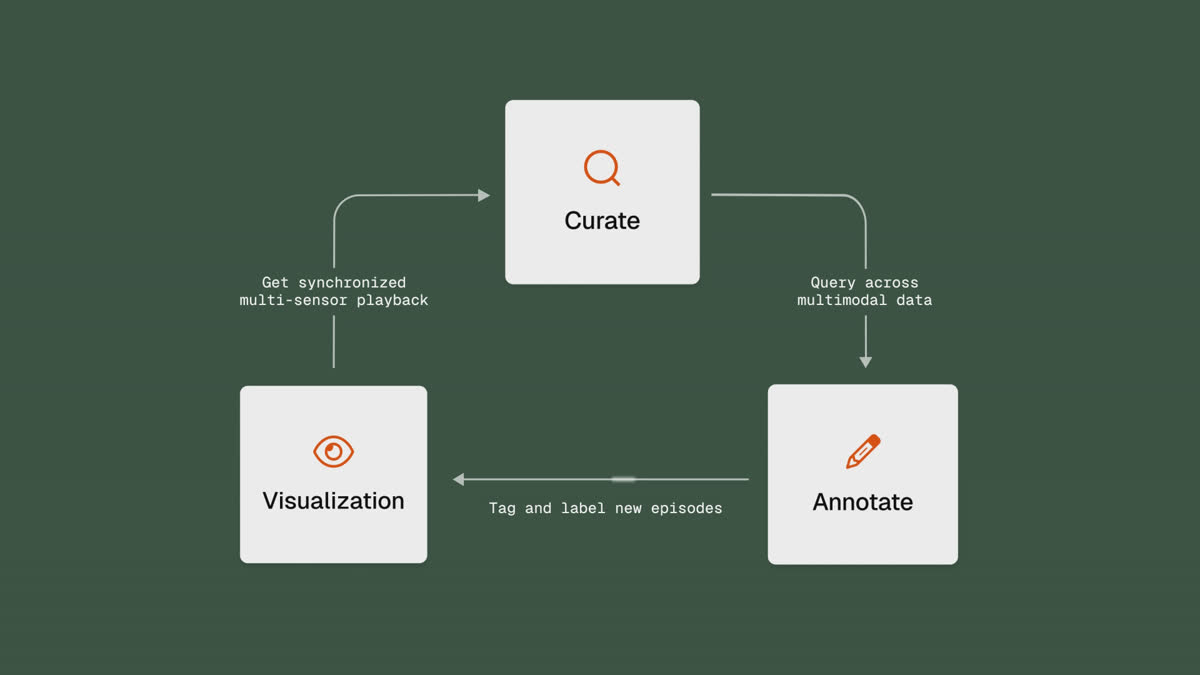
Because E2E and VLA architectures act as black boxes, data has become the primary way to understand and improve model behavior.
With today's launch, Voxel51 adds the ability to visualize and search multimodal data, enabling teams to uncover failure modes, identify coverage gaps, and systematically improve model performance.
Query multimodal data at scale
Voxel51 Search indexes your MCAP data into columnar tables that power the ability to search, filter, and mine events across your entire fleet of recordings. Unpack high-frequency sensor streams down to individual frames to isolate specific anomalies, while fully preserving the overarching scene context needed for root-cause analysis.
Label tracks & timelines
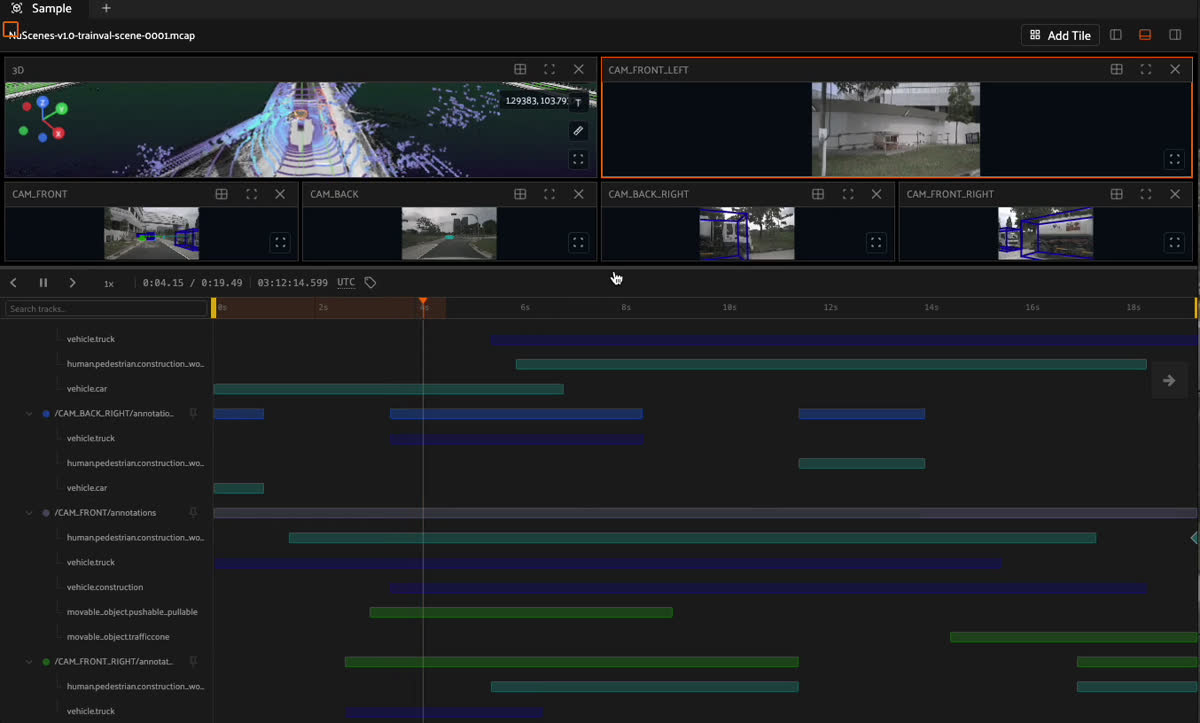
Labels persist as tracks across an entire episode, not isolated frame-by-frame annotations. See when objects appear, events unfold, or behaviors overlap on a shared timeline, then use those same tracks to query similar patterns across your entire dataset.
Embeddings-based search
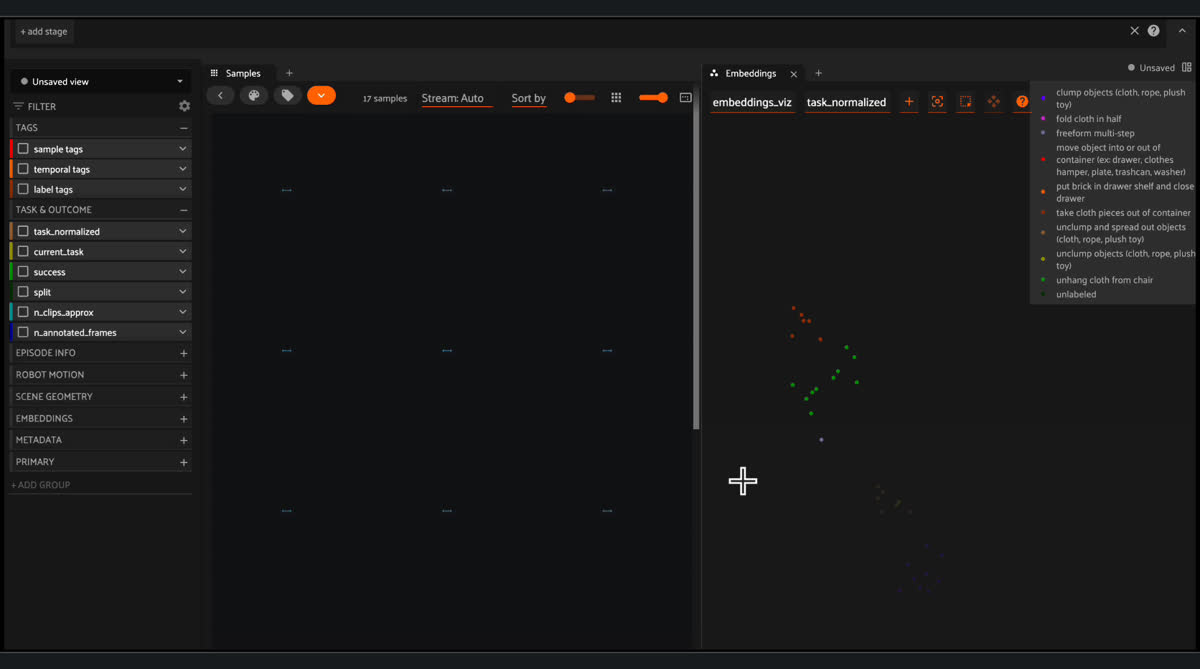
Search your entire dataset by visual or semantic similarity to find edge cases at scale. Instantly surface visually similar scenes, isolate glare anomalies, or locate underrepresented environments across both camera and LiDAR data—no labels required.
Fine-grained temporal tagging
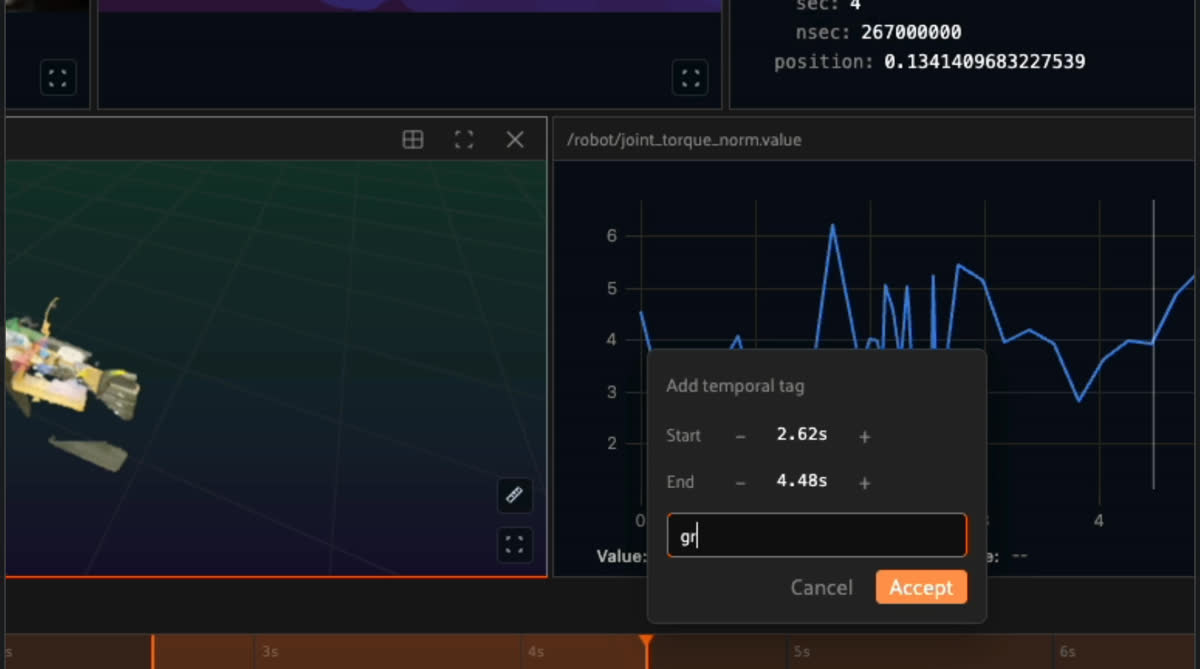
Tag arbitrary time intervals—such as a three-second window around a near-miss or a specific phase of a manipulation task—directly on continuous recordings. These temporal tags carry rich metadata, persist alongside your data, and are fully queryable.
MCAP ingestion & visualization
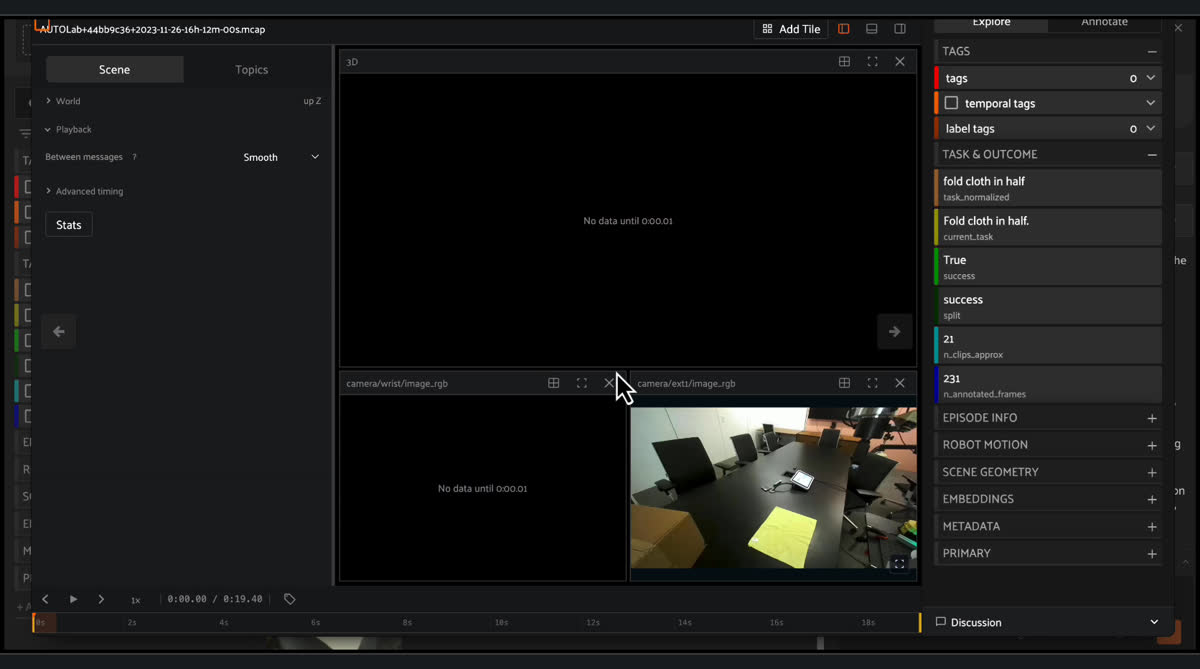
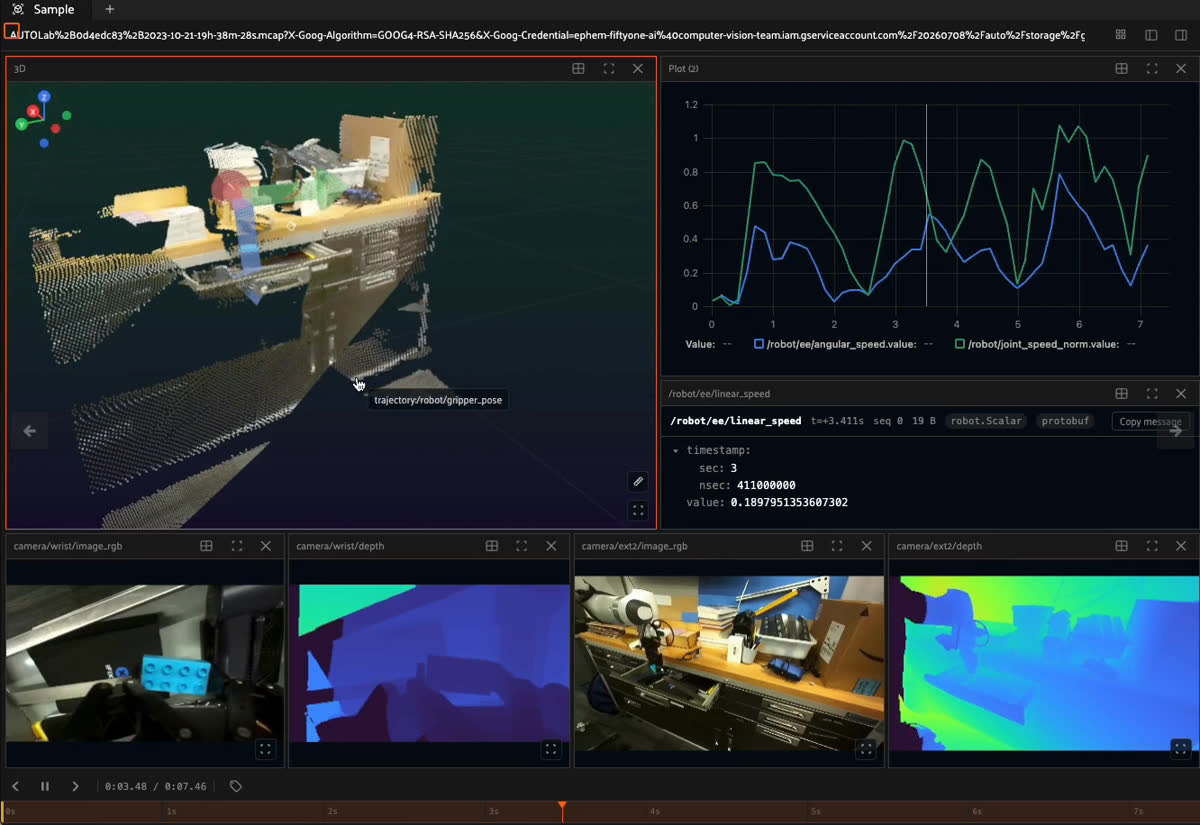
Voxel51 unpacks MCAP files natively without requiring lossy pre-extraction or frame-splitting pipelines. Camera feeds, 3D spatial data, numeric sensor plots, and annotations play back in a synchronized timeline. You see exactly what every sensor captured at the precise millisecond of a failure event.
Remove bottlenecks in your physical AI data flywheel
If an LLM hallucinates, a coding assistant references an API that doesn't exist. If physical AI hallucinates, a 4,000-pound autonomous vehicle misses a stop sign or a robotic arm drops an industrial payload.
The failures are material, expensive, and dangerous.
High-stakes deployments create a painful bottleneck: teams need to fix failures immediately, but cannot afford to introduce new ones. Without knowing how widespread a condition is across your dataset, even well-understood fixes can spend weeks in validation before engineers gain the confidence to ship.
"Some of our dips in model performance were because of edge cases. With Voxel51, we were able to catch them the same day we analyzed model performance, something that would have maybe taken a week otherwise. " — Terrance Whitehurst, ML Researcher, FloVision
Voxel51 removes this bottleneck by unifying curation, annotation, and evaluation into a data flywheel that lets you understand model behavior, and ship high-stakes physical AI with confidence.
- Eliminate data fragmentation and context switching: An end-to-end physical AI data engine like Voxel51 removes the scripting overhead and data integrity risks inherent in moving data across siloed tools.
- Prevent wasted compute cycles: Robotics training runs are notoriously slow and resource-intensive. Training on out-of-sync or redundant data wastes entire runs on sequences that teach the model false causal relationships. Curating high-value datasets ensures every training run moves the needle on performance and maximizes returns on scarce compute resources.
- Accelerate root cause analysis: When root-cause analysis takes minutes instead of days, teams gain the data context needed to validate fixes quickly and deploy with confidence. Isolate a failure visually via synchronized sensor playback, tag the exact temporal slice, and immediately run a query for similar conditions across your dataset.
- Prepare data for simulation and regression testing: When you can isolate a real-world failure, you can instantly turn that exact multi-sensor sequence into a test case. This allows you to generate highly accurate simulation scenarios and targeted test suites to ensure the failure never happens again.
- Reduce field failures and safety risks: In physical AI, regression is a critical safety liability. By isolating past field failures into curated, queryable evaluation datasets within Voxel51, teams can systematically test new model versions against historical anomalies. Ensuring that fixes don’t inadvertently reintroduce legacy safety failures reduces the risk of catastrophic accidents and brand damage.
Get started with Voxel51 for multimodal data
Today’s launch extends support for multimodal time-series data to FiftyOne Open Source and Voxel51.
| Feature | FiftyOne Open Source | Voxel51 |
|---|---|---|
| Native MCAP visualization | ✅ Yes | ✅ Yes |
| Temporal tags | ✅ Yes | ✅ Yes |
| Search and filter | ❌ No | ✅ Yes |
| Embeddings-based search | ❌ No | ✅ Yes |
| Label tracks & timelines | ❌ No | ✅ Yes |
Fragmented data kills development velocity. Voxel51 brings together synchronized playback, global dataset retrieval, and downstream annotation to transform your physical AI stack into data flywheel. Reach out to get started with Voxel51 or check out our docs for open source.
Want to see these workflows in action? Join us on August 11, 2026 for a live webinar and product demos.
Machine Learning Engineer
Passionate about Artificial Intelligence, Entrepreneurship and the intersection of the two.
See all articles by Prerna Dhareshwar
Try Voxel51 for yourself
Loading related posts...
© 2026 Voxel51 All Rights Reserved


