Top Agriculture Computer Vision Datasets in 2026: Crop & Weed Segmentation, Plant Phenotyping, 3D Point Clouds, and Precision Farming Data
Author

Hacker-in-Residence
Harpreet is Hacker-in-Residence at Voxel51, where he turns cutting-edge AI ideas into open-source prototypes and demos that push the boundaries of deep learning. From building tools that inspire to creating content that educates, Harpreet helps the AI community level up—one wild idea at a time.
See all articles by Harpreet Sahota
In this article
Key TakeawaysThe Comparison TableDataset Schema Reference: Media Types, Label Fields & Hugging Face LinksCrop and Weed Segmentation Datasets (UAV, RGB-D, and Multispectral)Orchard, Fruit Detection, and Growth-Stage Phenotyping DatasetsPlant Disease and Species Classification Datasets3D Point Cloud Datasets for Plant and Crop PhenotypingSatellite and Aerial Remote Sensing Datasets for AgricultureAgricultural Robotics and Physical AI DatasetsTry It YourselfFrequently Asked Questions
In this article
Key TakeawaysThe Comparison TableDataset Schema Reference: Media Types, Label Fields & Hugging Face LinksCrop and Weed Segmentation Datasets (UAV, RGB-D, and Multispectral)Orchard, Fruit Detection, and Growth-Stage Phenotyping DatasetsPlant Disease and Species Classification Datasets3D Point Cloud Datasets for Plant and Crop PhenotypingSatellite and Aerial Remote Sensing Datasets for AgricultureAgricultural Robotics and Physical AI DatasetsTry It YourselfFrequently Asked Questions
Try Voxel51 for yourself
A field guide to 14 open agriculture computer vision datasets, organized by task and label type — crop/weed segmentation, orchard and fruit detection, plant disease classification, 3D point clouds, satellite field mapping, and robotics — with the exact media type, label fields, and a direct Hugging Face link for each one, so you know what’s actually inside before you download anything.
A field doesn’t look like ImageNet. The lighting changes hour to hour, a crop and the weed choking it can be the same shade of green, and the “object” you’re detecting today is a two-leaf seedling that will be a shoulder-high plant in six weeks. Most general-purpose vision models have never seen anything like it.
That’s exactly why agricultural computer vision needs its own datasets, and why so many of the best ones are stranger than a typical detection benchmark: point clouds instead of pixels, five spectral bands instead of three, robots that leave the frame and come back expecting you to remember who they were. Sensors are cheap now — RGB-D rigs, five-band multispectral drones, RTK-GPS UAV LiDAR — and the harder problem has shifted to what to do with everything they capture.
We pulled together 14 datasets, all currently mirrored in FiftyOne format on the Voxel51 Hugging Face org, spanning row-crop weed segmentation, orchard phenotyping, plant disease classification, 3D point clouds, satellite-scale field mapping, and a robot that has to recognize a lettuce it met five minutes ago. Below, each dataset gets a self-contained blurb — name, task, size, license, year — plus its exact FiftyOne media type, its label fields and their types, a short field list, and a direct link to the dataset on Hugging Face, grouped by exactly what kind of dataset you’re looking for, before we close by laddering up to where a lot of this data is really headed: physical AI.
Key Takeaways
- 14 datasets, 6 media/sensor types — RGB image, RGB-D image, 5-band multispectral image, Sentinel-2 satellite image, 3D point cloud, and video — and 8 distinct FiftyOne label types across them:
Classification,Classifications,Detections,Detection,Segmentation,Keypoints,Keypoint, andHeatmap. - Looking for a crop-and-weed segmentation dataset? Start with
CropAndWeed,WeedsGalore,PhenoBench, orWE3DS— each pairs pixel-level crop/weed masks with a different sensor (ground RGB, UAV multispectral, UAV RGB, and RGB-D, respectively). - Looking for a plant phenotyping or growth-stage dataset?
AppleGrowthVision,GrowliFlower, andTomatoMAPall tie imagery to a BBCH or measured-trait timeline, from bud break through fruit maturity. - Looking for a 3D point cloud dataset for agriculture?
Pheno4D,Crops3D, andVineLiDARskip pixels entirely and ship raw geometry — exactly the ground truth a field robot’s depth sensor or LiDAR unit needs, not just its camera. - Three datasets are FiftyOne grouped datasets with multiple slices per sample —
AppleGrowthVision(left/right/image),GrowliFlower(pre/post),TomatoMAP(pos_1–pos_4/macro), andFields of the World(window_a/window_b) — meaning each “sample” is really a synchronized set of related images, not a single standalone one. - Licensing is genuinely mixed — CC BY 4.0 is common, but
CropAndWeedis non-commercial-only,PlantWildis CC BY-NC-ND, andFields of the Worldinherits 24 different national licenses depending on the country tile. Check before you train a commercial model.
The Comparison Table
| Dataset | Task | Size | Modality | License | Year |
|---|---|---|---|---|---|
| CropAndWeed | Detection, segmentation, keypoints | 8,034 images, ~112K instances | RGB (ground-level) | Custom non-commercial | 2023 |
| WeedsGalore | Semantic + instance segmentation | 156 tiles, ~78 instances/tile | UAV multispectral (R/G/B/NIR/RE) | CC BY 4.0 | 2025 |
| PhenoBench | Semantic, instance & panoptic segmentation | 2,872 images | UAV RGB | CC BY-SA 4.0 | 2024 |
| WE3DS | Semantic segmentation | 2,568 images | RGB-D (stereo) | CC BY 4.0 | 2023 |
| AppleGrowthVision | Detection + growth-stage classification | 11,397 groups, 21,407 images | Stereo RGB + handheld RGB | CC BY 4.0 | 2025 |
| GrowliFlower | Instance segmentation + growth-trait regression | 24,866 samples, 23,875 groups | UAV RGB + multispectral | Unspecified | 2022 |
| TomatoMAP | Classification, detection, instance segmentation | 68,069 images | RGB (rig + macro) | CC BY 4.0 | 2026 |
| PlantWild | Image classification (multimodal) | 30,030 images, 146 classes | RGB + text | CC BY-NC-ND 4.0 | 2024 |
| Pheno4D | Semantic + instance segmentation, registration | 223 scans (14 plants) | 3D point cloud (laser scan) | Unspecified | 2021 |
| Crops3D | Classification, instance/organ segmentation | 1,180 point clouds, 8 crops | 3D point cloud (MVS + structured light) | CC BY 4.0 | 2024 |
| VineLiDAR | 3D reconstruction (unlabeled) | 10 point clouds | UAV LiDAR (RGB-colored) | CC BY 4.0 | 2023 |
| Fields of the World | Instance + semantic segmentation | 70,484 chips, 140,968 samples, 25 countries | Sentinel-2 satellite (multispectral, 2-date) | Varies by country | 2024 |
| AgroMind | VQA benchmark (13 task types) | 21,339 images, 28,482 QA pairs | RGB (satellite/UAV/ground) + text | CC BY-SA 4.0 | 2025 |
| LettuceMOTS | Multi-object tracking + segmentation | 12 videos, 1,308 frames, 314 tracks | RGB video (robot-mounted) | CC BY 4.0 | 2024 |
Keep it honest. “Year” above is publication year of the associated paper/release, not necessarily when data collection happened — several of these (WE3DS, PhenoBench) were captured a year or two before publication. And “Size” reflects each FiftyOne parsing specifically; a couple of the source releases (GrowliFlower, WeedsGalore) ship additional unlabeled orthomosaic imagery that isn’t included in the sample counts above.
Dataset Schema Reference: Media Types, Label Fields & Hugging Face Links
This is the table to bookmark if you already know your sensor and task and just need to know what’s in the box before you
load_from_hub(). “Media Type” is the FiftyOne media_type of the dataset (and whether it’s grouped, meaning multiple slices per sample); “Label Fields” lists the actual field names and their FiftyOne label types.| Dataset | Media Type | Label Fields (FiftyOne Types) |
|---|---|---|
| CropAndWeed | Image | ground_truth (Detections, 100 classes), stem_points (Keypoints), segmentation (Segmentation) |
| WeedsGalore | Image | ground_truth_semantic (Segmentation, 6 classes), ground_truth (Detections, instance masks) |
| PhenoBench | Image | ground_truth_semantic (Segmentation, 5 classes), ground_truth_plants (Detections), ground_truth_leaves (Detections) |
| WE3DS | Image | ground_truth (Segmentation, 19 classes), depth_raw/depth_refined (Heatmap) |
| AppleGrowthVision | Image, grouped (left/right/image) | ground_truth (Detections, 1 class: apple) |
| GrowliFlower | Image, grouped (pre/post) | plant_instances/leaf_instances (Detections), stem_keypoints (Keypoints), void_mask (Segmentation) |
| TomatoMAP | Image, grouped (pos_1-pos_4/macro) | ground_truth (Detections, ROI boxes or fruit/flower instance masks), classification (Classification, BBCH stage) |
| PlantWild | Image | ground_truth (Classification, 146 classes) |
| Pheno4D | 3D point cloud | ground_truth/ground_truth_collar/ground_truth_tip (Detections, 3D boxes) |
| Crops3D | 3D point cloud | ground_truth (Classification, 8 crop types) |
| VineLiDAR | 3D point cloud | None (unlabeled raw geometry) |
| Fields of the World | Image, grouped (window_a/window_b) | ground_truth_2class/ground_truth_3class (Segmentation), field_instances (Detections) |
| AgroMind | Image | oc_label/disease/climate_zone (Classification), anomalies (Classifications, multilabel), cultivated_area (Detection), anomaly_at_point (Keypoint) |
| LettuceMOTS | Video | ground_truth (Detections, per-frame, with mask + tracking index) |
Crop and Weed Segmentation Datasets (UAV, RGB-D, and Multispectral)
This is the classic agricultural CV problem: a camera looks straight down at a bed of plants, and the model has to decide, pixel by pixel, which ones are the crop and which ones are stealing its water. If you’re searching for a crop/weed segmentation dataset, weed detection dataset, or field-scale semantic segmentation dataset, start here.
CropAndWeed
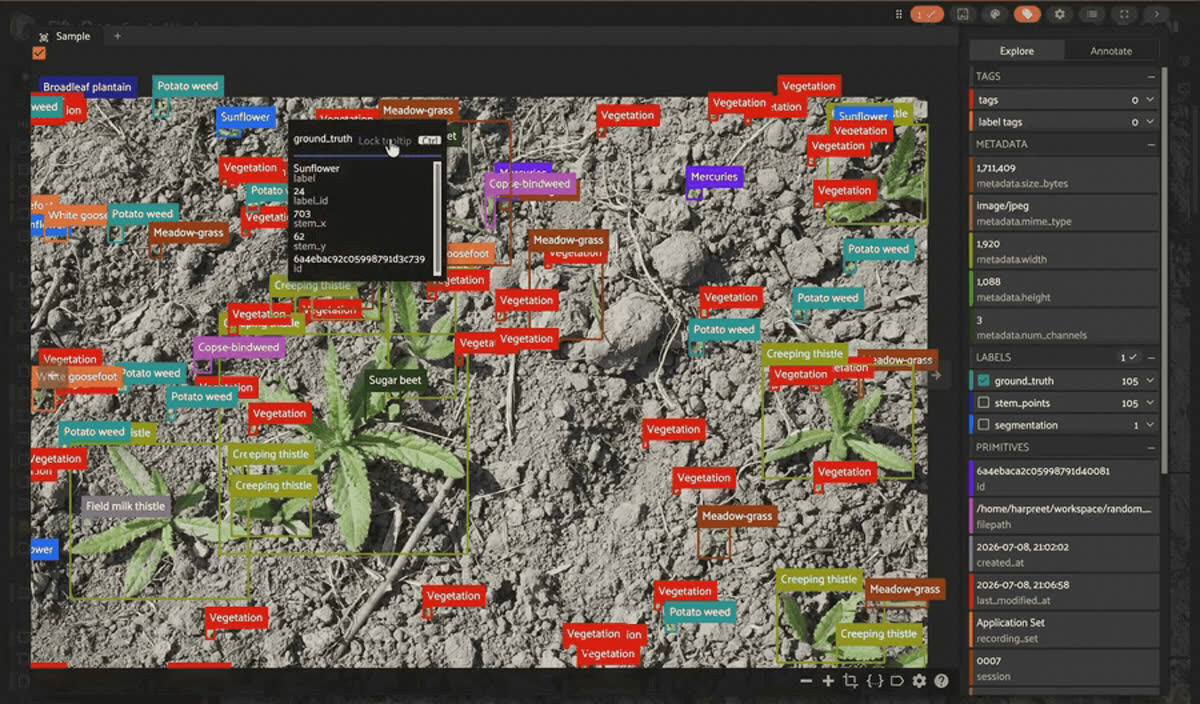
CropAndWeed dataset in the FiftyOne app showing top-down field images with crop and weed detection labels
CropAndWeed is a crop and weed object detection, semantic segmentation, and stem-keypoint dataset built from 8,034 top-down, real-world field images (74 crop and weed species, 100 fine-grained classes) shot with a fixed 50mm lens at ~1.1m height across four growing seasons in Austria. Every one of the ~112K plant instances gets a bounding box, a stem keypoint, and a semantic mask, plus per-image
moisture/soil/lighting/separability tags describing the conditions it was shot in. It’s the largest multi-modal (box + point + mask) crop/weed dataset in this list, but the license is non-commercial only — read it before you build a product on it.Fields. Media type:
image (flat). Labels: ground_truth (Detections, box + label_id + stem_x/stem_y), stem_points (Keypoints), segmentation (Segmentation, referencing mask_path). Metadata: recording_set, session, image_id, moisture/soil/lighting/separability (+ numeric _id variants).WeedsGalore
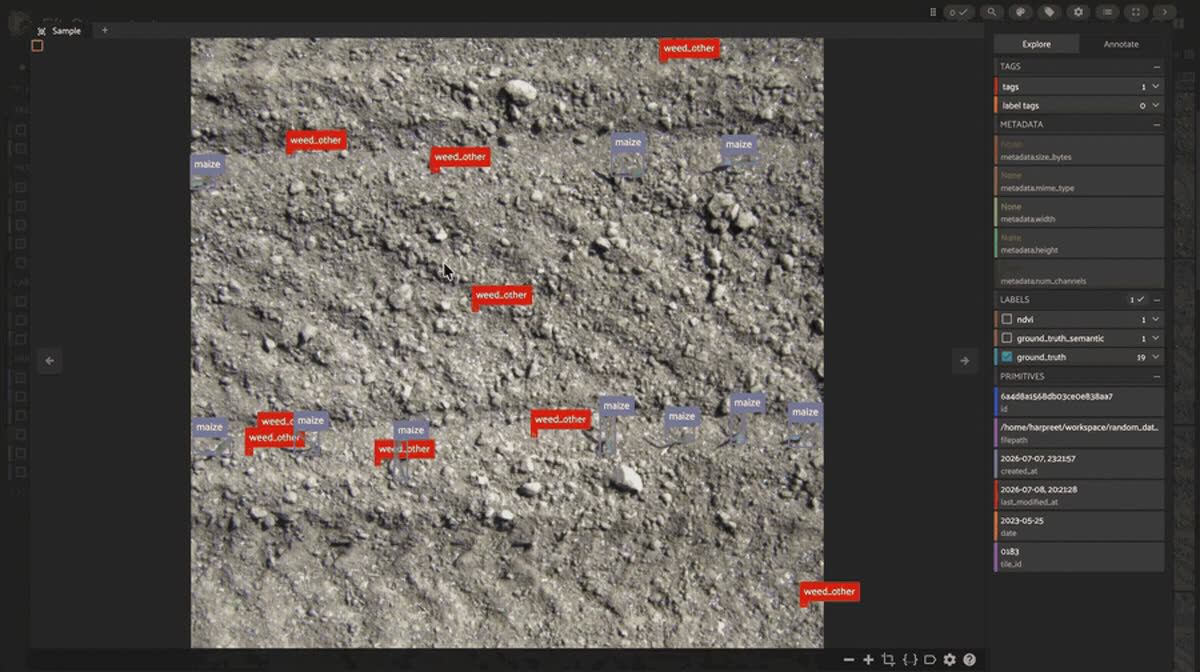
WeedsGalore UAV multispectral maize tiles displayed as a grid in the FiftyOne app
WeedsGalore is a UAV-based multispectral crop-and-weed segmentation dataset for maize fields. 156 tiles sound small next to CropAndWeed’s 8,034, but the plant density per image is the highest of any public weed-segmentation dataset at publication time: ~78 annotated instances per 600×600px tile. The five-band UAV capture (R/G/B/red-edge/NIR) over one real maize field in Potsdam, Germany, across four growth-stage flights, lets you test whether NIR/red-edge actually helps
maize vs. amaranth vs. barnyard_grass segmentation over RGB alone.Fields. Media type:
image (flat). Labels: ground_truth_semantic (Segmentation, 6 classes: background/maize/amaranth/barnyard_grass/quickweed/weed_other), ground_truth (Detections, per-instance mask + plant_instance_id). Metadata: ndvi (Heatmap), date, tile_id, tags (train/val/test).PhenoBench
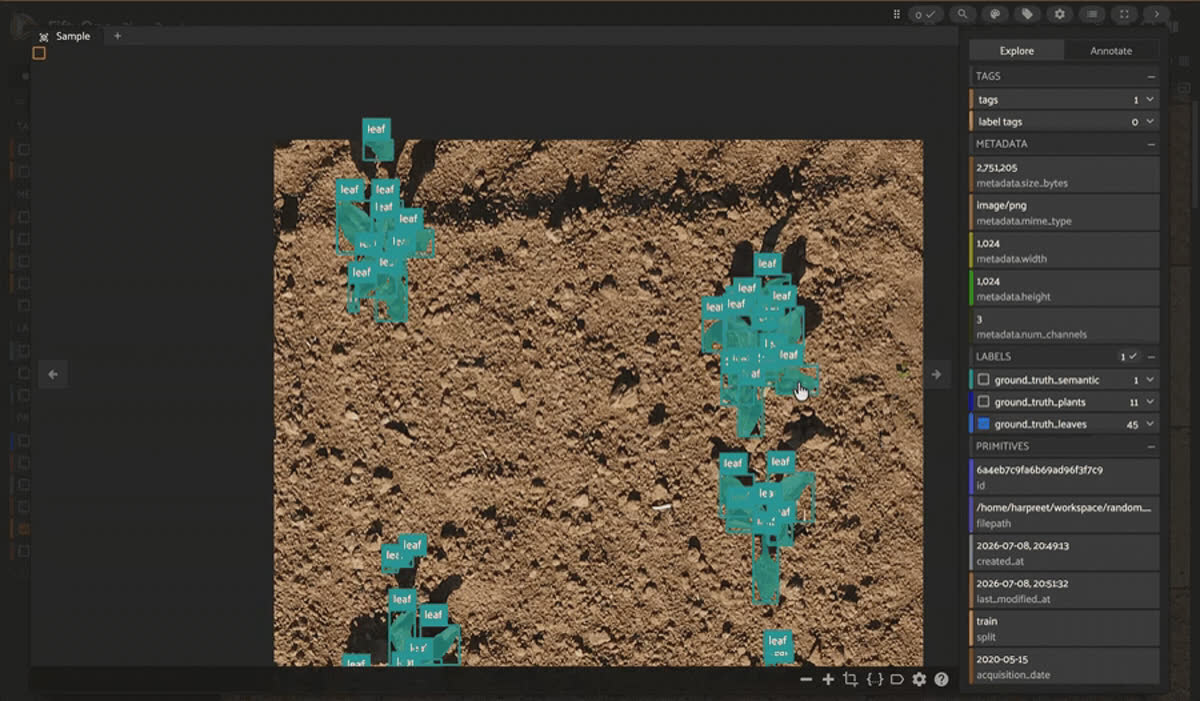
PhenoBench sugar beet crop and weed segmentation samples in the FiftyOne app
PhenoBench is a UAV RGB dataset for sugar beet crop and weed semantic, instance, and panoptic segmentation: 2,872 images of a single ~1,300 m² field, annotated at three levels simultaneously — semantic (
crop/weed/partial_crop/partial_weed), plant-instance, and, uniquely, crop leaf-instance, with a per-instance visibility score baked into every mask. That third layer supports “hierarchical panoptic segmentation,” a task designed to mirror how a plant scientist actually counts leaves per plant to gauge growth stage.Fields. Media type:
image (flat). Labels: ground_truth_semantic (Segmentation, 5 classes), ground_truth_plants (Detections, with visibility and mask), ground_truth_leaves (Detections, with visibility and source_plant_instance_id). Metadata: tags (train/val/test), acquisition_date.Good to know. Why is the test split empty? PhenoBench’s test labels are withheld for a server-side leaderboard at phenobench.org — you submit predictions rather than eval locally.
WE3DS
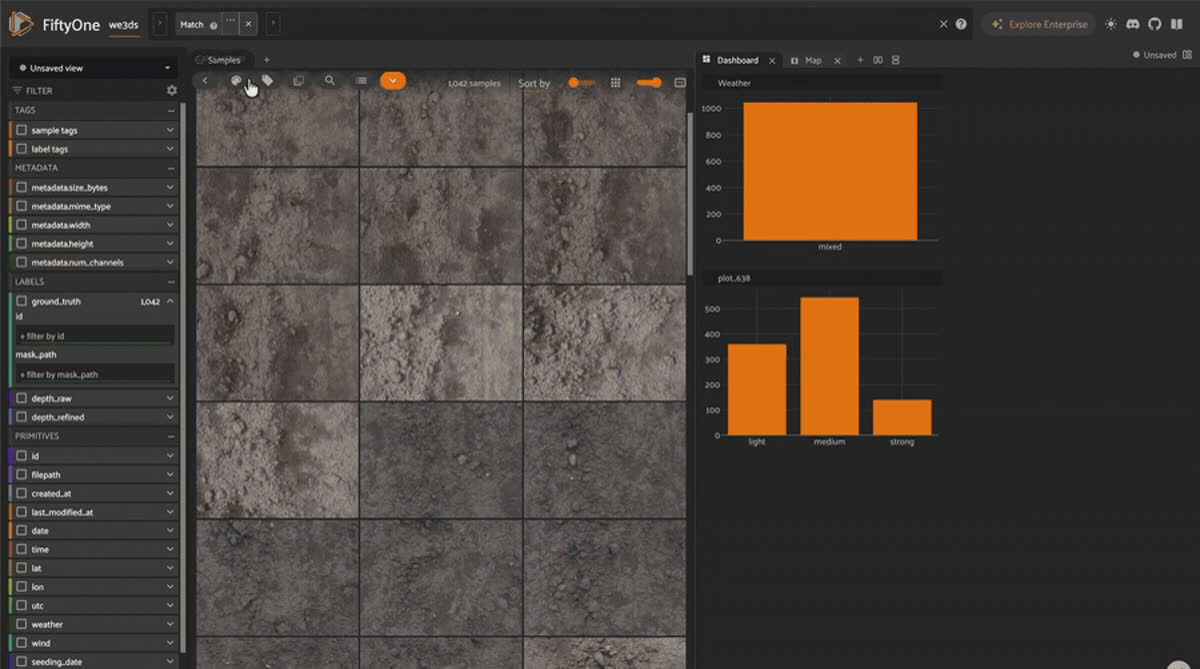
WE3DS RGB-D sample with a depth map and per-pixel crop and weed mask in the FiftyOne app
WE3DS is an RGB-D (depth) semantic segmentation dataset for crop and weed species identification: 2,568 image pairs from a custom stereo trolley pushed down crop rows at BOKU’s experimental farm in Austria, across 25 measurement dates. 18 real classes (7 crops, 10 weeds, plus soil) get dense per-pixel masks, and every image is paired with a raw and a hole-filled depth map — the paper’s own benchmark shows RGB-D beats RGB-only (70.7% vs. 70.1% mIoU), a small but real signal that depth is worth carrying into your pipeline.
Fields. Media type:
image (flat). Labels: ground_truth (Segmentation, 19 classes). Also: depth_raw/depth_refined (Heatmap), location (GeoLocation), weather, wind, height_mm.Orchard, Fruit Detection, and Growth-Stage Phenotyping Datasets
Here, the question isn’t just “what plant is this?”; it’s “what stage of its life cycle is this plant in, and how much fruit will it produce?” If you’re searching for a fruit detection dataset, BBCH growth-stage classification dataset, or plant phenotyping dataset, this is your group.
AppleGrowthVision
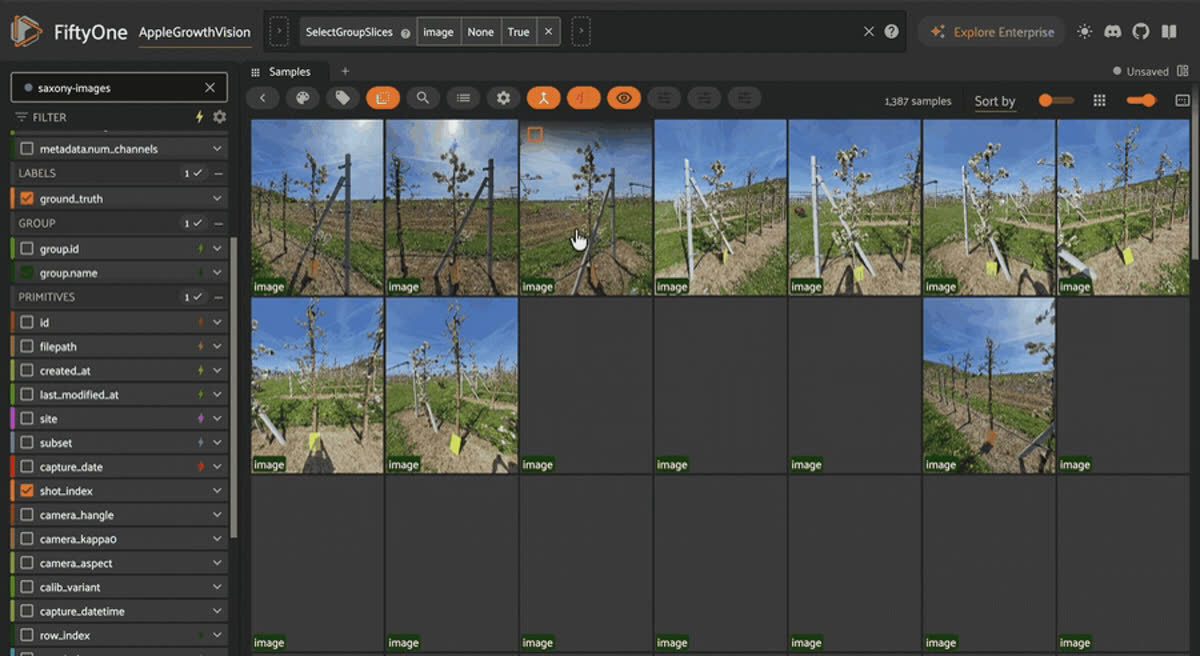
AppleGrowthVision orchard images grouped by stereo left, right, and image slices in the FiftyOne app
AppleGrowthVision is an apple orchard object detection and BBCH growth-stage classification dataset spanning 11,397 groups (21,407 images) across two very different capture setups: a calibrated stereo rig photographing 33 Jonagold trees in Brandenburg, Germany, over 18 sessions, and handheld smartphone shots of an orchard in Saxony. Every image is tagged to a specific point on the BBCH phenological scale, and a 6.8% annotated subset carries apple bounding boxes — small but concentrated exactly in the fruit-visible growth stages (BBCH 5-9) where detection actually matters.
Fields. Media type:
image, grouped (left/right/image slices). Labels: ground_truth (Detections, single class apple). Metadata: group (Group), bbch_code/bbch_principal_stage/bbch_stage_name, num_apples, reference_apple_count.Keep it honest. Only ~1,457 of the 21,407 images have
ground_truth boxes. Filter to the annotated or has-apples saved views before treating this as a detection-ready set.GrowliFlower
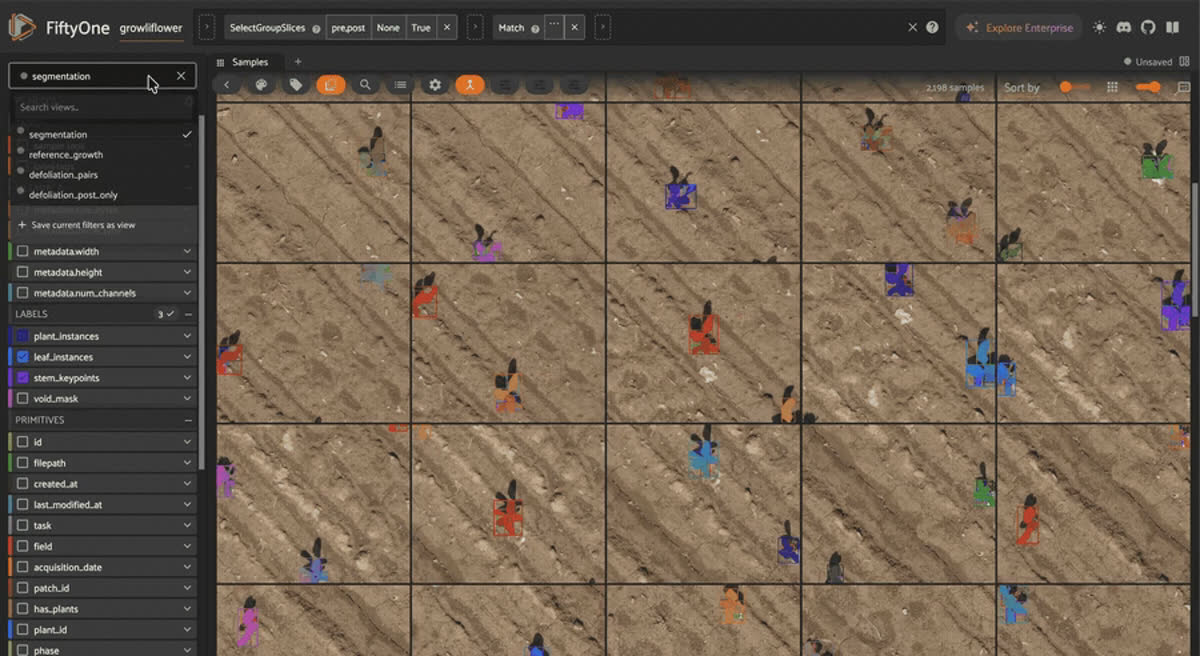
GrowliFlower UAV cauliflower plants with colored instance segmentation masks in the FiftyOne app
GrowliFlower is a UAV cauliflower instance segmentation and growth-trait phenotyping dataset: 24,866 samples across 23,875 groups, consolidating three time-series subsets of two German cauliflower fields into one dataset — pixel-accurate plant/leaf/stem segmentation patches, a growth-curve subset with real measured
in_situ_height/in_situ_diameter/in_situ_bbch_stage traits, and a defoliation subset with paired pre/post leaf-removal images that expose the cauliflower head hiding under the canopy, the whole reason cauliflower yield estimation from imagery is hard in the first place.Fields. Media type:
image, grouped (pre/post slices). Labels: plant_instances/leaf_instances (Detections), stem_keypoints (Keypoints), void_mask (Segmentation). Metadata: task (segmentation/reference/defoliation), plant_id, in_situ_height/in_situ_diameter/in_situ_bbch_stage/in_situ_head_diameter.TomatoMAP
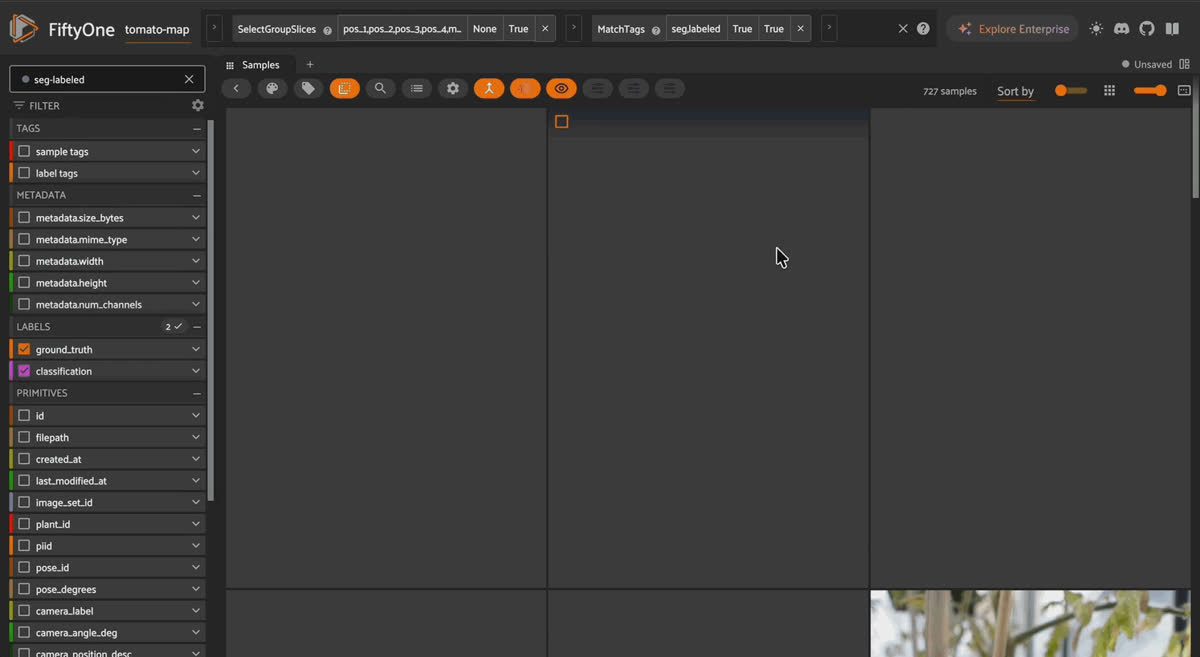
TomatoMAP multi-view tomato plant images with ROI detection boxes in the FiftyOne app
TomatoMAP is a multi-view tomato phenotyping dataset combining BBCH growth-stage classification, region-of-interest object detection, and fruit/flower developmental-stage instance segmentation. Its 68,069 images make it the largest 2D dataset on this list, generated by an IoT imaging station that rotated 101 tomato plants through 12 turntable poses under 4 fixed cameras every few days for 163 days — 64,464 rig images with 7-class ROI boxes and 50-class BBCH labels, plus 3,605 macro close-ups of individual flowers and fruit with developmental-stage instance masks. It’s a genuinely automated phenotyping pipeline: no human walked a field with a camera for this one.
Fields. Media type:
image, grouped (pos_1-pos_4 rig slices / macro slice). Labels: ground_truth (Detections — 7-class ROI boxes on the rig subset, 10-class fruit/flower instance masks on the macro subset), classification (Classification, BBCH stage, e.g. "bbch_70"). Metadata: bbch_stage, plant_id, pose_id, camera_label, capture_datetime.Plant Disease and Species Classification Datasets
If you’re searching for a plant disease classification dataset or an in-the-wild leaf disease image dataset, this is the one entry in the list built for that exact task.
PlantWild
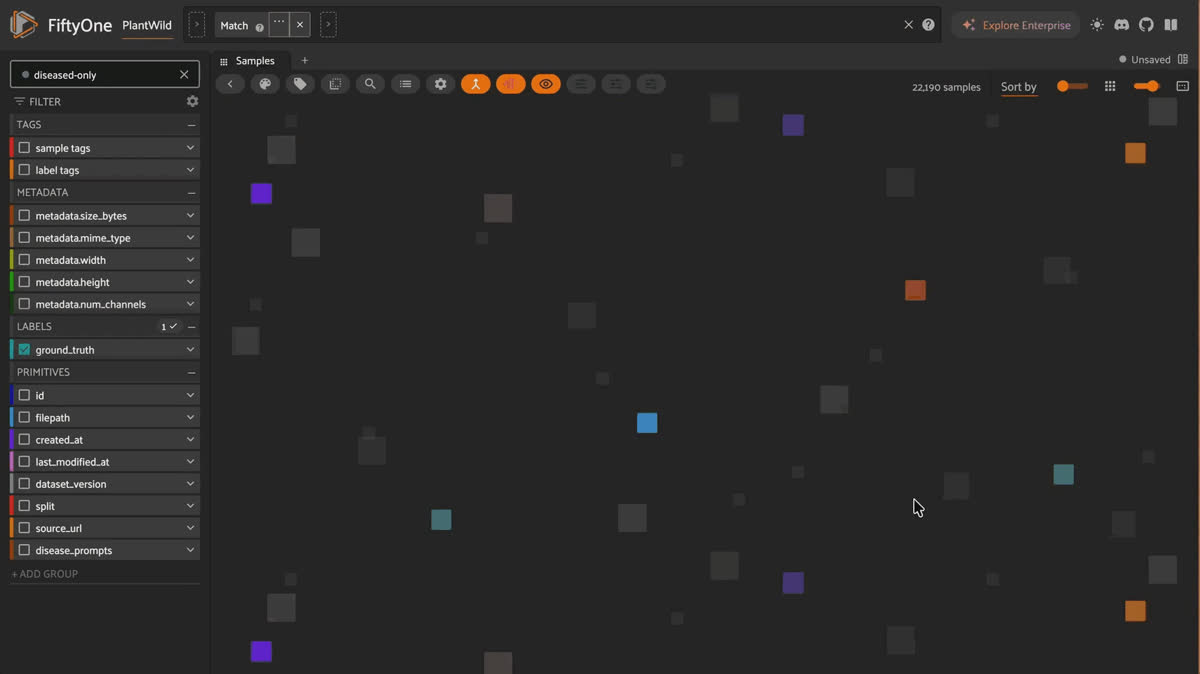
PlantWild in-the-wild plant disease leaf images labeled by class in the FiftyOne app
PlantWild is an in-the-wild, multimodal plant disease image classification dataset: 30,030 images across 146 disease/healthy-leaf classes, crowdsourced from Google/Ecosia/Baidu image search rather than shot in a lab — which means real backgrounds, real lighting, real clutter, unlike PlantVillage’s studio-clean leaves. Every class also ships 50 GPT-3.5-generated descriptive text prompts, making this one of the few plant-disease datasets built explicitly for CLIP-style multimodal (image + text) classification, not just a softmax over leaf photos.
Fields. Media type:
image (flat). Labels: ground_truth (Classification, 146 classes). Metadata: disease_prompts (list of 50 text strings per class), dataset_version (v1/v2), split, source_url.Keep it honest. The license is CC BY-NC-ND — no commercial use, no derivatives. If you need pixel-level disease localization instead of image-level labels, the companion PlantSeg dataset is the one to reach for.
3D Point Cloud Datasets for Plant and Crop Phenotyping
Pixels show you what a plant looks like from a single angle. Point clouds tell you its actual shape — which is what a robot arm's or an autonomous sprayer’s collision model actually needs. Search for a 3D point cloud dataset for agriculture, a plant phenotyping point cloud, or a LiDAR vineyard dataset, and these three are what you’ll want.
Pheno4D
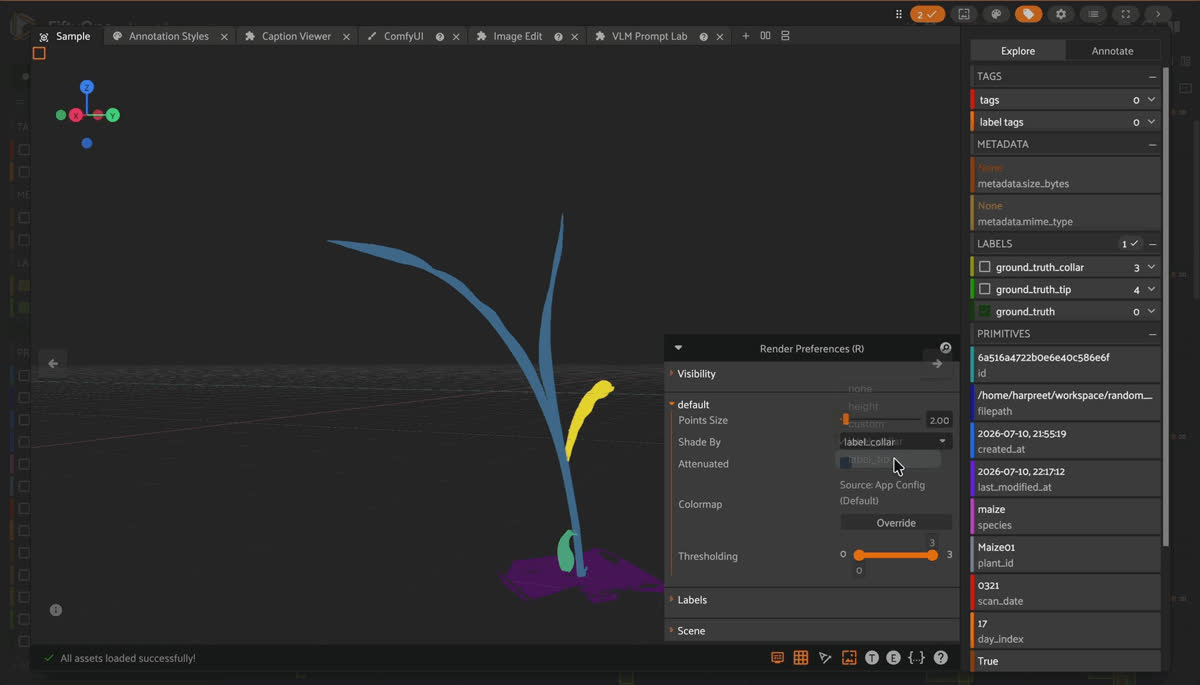
Pheno4D 3D point cloud scan of a maize plant with per-organ labels in the FiftyOne app
Pheno4D is a 3D point cloud dataset for maize and tomato plant phenotyping, with per-organ semantic and instance segmentation: 223 scans of 7 maize and 7 tomato plants, scanned daily over 12 and 20 days, respectively, with a sub-millimetre laser triangulation scanner (σ ≈ 0.012mm) mounted on a measuring arm. A labeled subset carries temporally consistent per-leaf instance IDs — the same leaf keeps the same ID across the whole growth series — which is exactly the kind of ground truth needed for non-rigid point-cloud registration and growth-tracking research, not just single-frame segmentation.
Fields. Media type:
point-cloud (flat, .pcd files). Labels: ground_truth (Detections, 3D boxes, tomato only), ground_truth_collar/ground_truth_tip (Detections, 3D boxes, maize only, two parallel labeling conventions). Metadata: species, plant_id, day_index, is_labeled, num_points. Raw per-point semantic/instance labels are preserved as scalar PCD attributes viewable via the App’s “Shade By” render mode.Crops3D
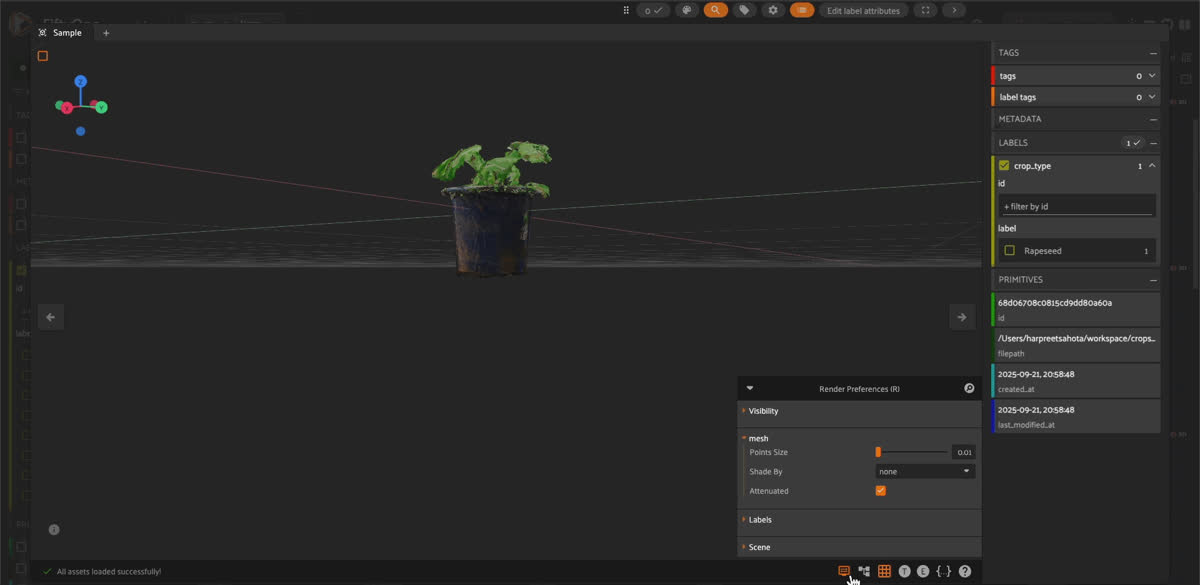
Crops3D RGB-colored 3D point cloud of a crop plant in the FiftyOne app
Crops3D is a multi-crop 3D point cloud dataset for plant classification and organ segmentation: 1,180 RGB-colored point clouds across 8 crop types (maize, cabbage, cotton, rapeseed, wheat, potato, rice, tomato), captured with a mix of multi-view stereo and structured-light scanning. Where Pheno4D goes deep on two species over time, Crops3D goes wide across species — useful if your model needs to generalize crop-type classification from 3D shape alone, not just RGB texture.
Fields. Media type:
point-cloud/3D scene (flat, .fo3d scenes referencing .ply meshes). Labels: ground_truth (Classification, 8 crop types). The source release’s Crops3D_IS variant additionally supports plot-level instance segmentation, which is not included in this specific FiftyOne build.VineLiDAR
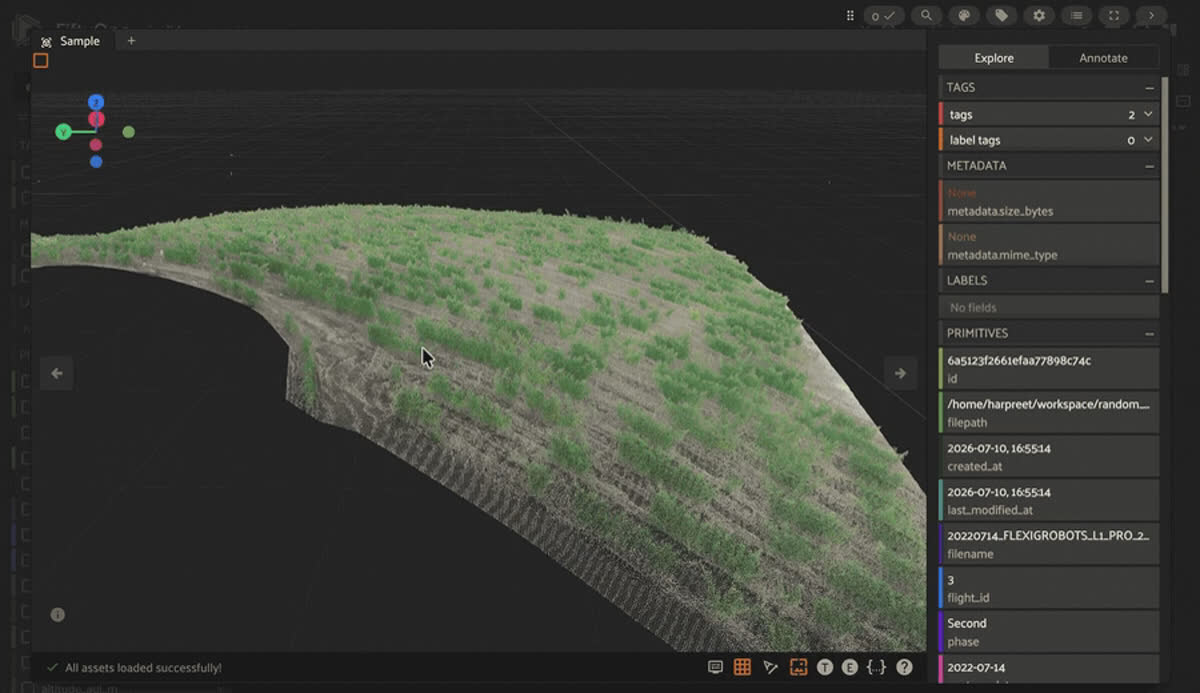
VineLiDAR UAV LiDAR point cloud of vineyard rows in the FiftyOne app
VineLiDAR is a UAV LiDAR point cloud dataset for vineyard and viticulture 3D reconstruction: 10 high-density, RGB-colored point clouds from a DJI M300 + Zenmuse L1 sensor, flown over two Spanish vineyard blocks at three altitudes across two years. There are no labels here at all — it’s raw geometry, meant as ground truth for canopy height models, digital twins, and validating satellite-derived vineyard models, or for testing UAV/UGV flight-path planning against real terrain rather than a simulator’s approximation of one.
Fields. Media type:
point-cloud (flat, .pcd files, no label fields). Metadata: flight_id, phase, vineyard_block, altitude_agl_m, num_points_full/num_points_view, bounds_min_*/bounds_max_*, offset_*, extent_*.Satellite and Aerial Remote Sensing Datasets for Agriculture
Zoom out from a single field to a satellite pass, and the questions change from “where’s the weed” to “where does one farmer’s field end and the next one begin” — or, with a big enough model, “can you reason about any of this at all.” If you’re searching for a satellite field-boundary segmentation dataset or an agricultural remote-sensing VQA benchmark, this is your group.
Fields of the World
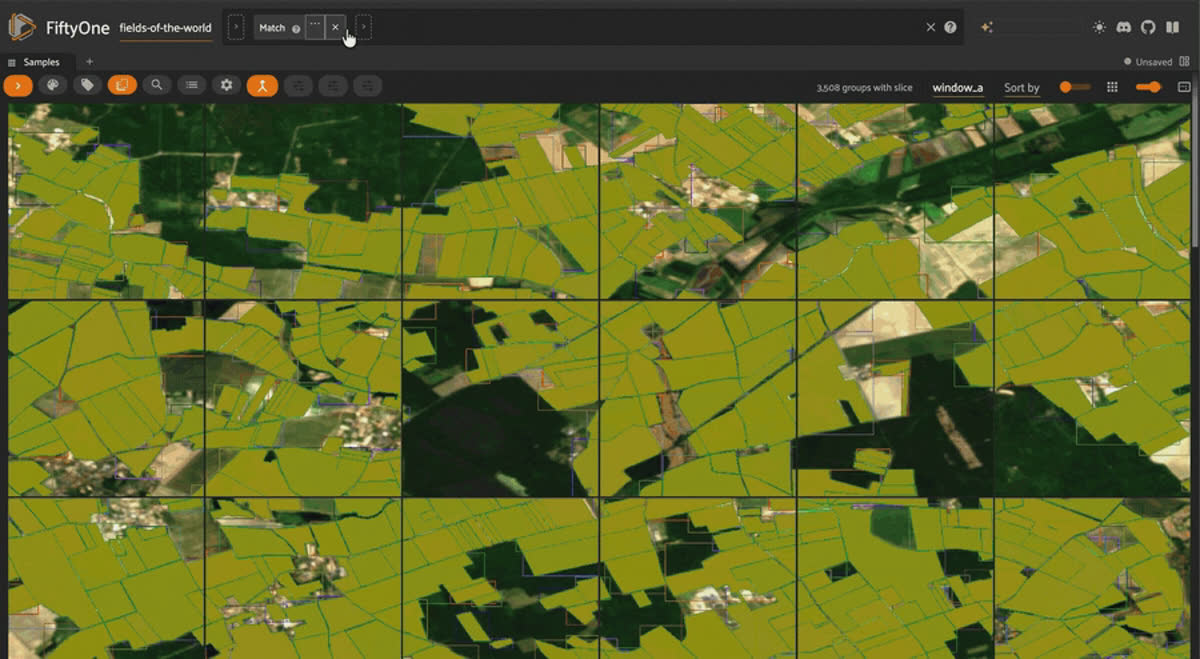
Fields of the World Sentinel-2 satellite chips with a country distribution chart and world map in the FiftyOne app
Fields of the World is a Sentinel-2 satellite dataset for agricultural field boundary instance and semantic segmentation: 70,484 chips (140,968 samples across two acquisition windows) spanning 25 countries and four continents — an order of magnitude larger than prior field-boundary benchmarks like PASTIS or AI4Boundaries. Each chip pairs two-date, four-band satellite imagery with binary, 3-class, and full-instance segmentation of field boundaries, aggregated from 24 national data sources.
Fields. Media type:
image, grouped (window_a/window_b slices). Labels: ground_truth_2class (Segmentation, background/field/unknown), ground_truth_3class (Segmentation, background/interior/boundary/unknown), field_instances (Detections, one per field polygon). Metadata: country, split, location (GeoLocation), unknown_fraction, field_area_fraction.Keep it honest. There’s no single license — each country’s field polygons carry the license assigned by their original government or research source. Check the per-country terms before redistributing.
AgroMind
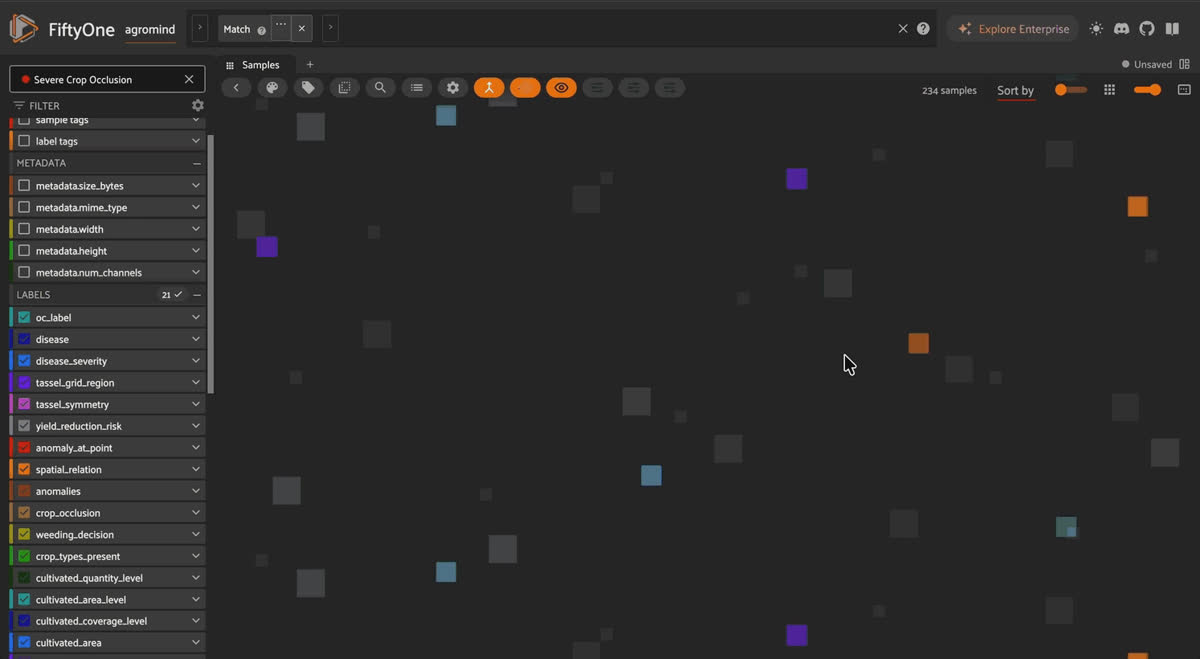
AgroMind agricultural visual question answering images across task-based saved views in the FiftyOne app
AgroMind is a multimodal visual-question-answering (VQA) benchmark dataset for agricultural scene reasoning — the outlier of the group, since it isn’t new field imagery at all. It’s a benchmark stitched together from nine public agricultural CV datasets (including PhenoBench, from earlier in this list) plus one private farmland-parcel set, re-packaged as 28,482 QA pairs across 13 task types — crop identification, tassel counting, climate-zone reasoning, spatial relationships between anomalies, and more. It exists to test whether large multimodal models can actually reason about a farm scene end-to-end, not just classify or detect within it. The paper’s headline finding: even the strongest models it tested score well under 50% overall accuracy.
Fields. Media type:
image (flat) + raw text QA. Labels: oc_label/disease/climate_zone/biome (Classification), anomalies (Classifications, multilabel), cultivated_area (Detection), spatial_relation (Classification), anomaly_at_point (Keypoint), plus ~15 Int/Float count and measurement fields (tassel_count_total, tree_coverage_pct, etc.). The raw qa field (list of dicts) preserves every question-answer pair verbatim, including ones without a promoted typed field.Agricultural Robotics and Physical AI Datasets
Look back at that list, and a pattern falls out: half of these datasets weren’t captured by a person with a handheld camera at all. WeedsGalore, PhenoBench, GrowliFlower, and Fields of the World were collected by drones. VineLiDAR came from a UAV-mounted LiDAR unit purpose-built for terrain mapping. AppleGrowthVision’s stereo rig is specifically designed to support 3D orchard reconstruction, not just 2D detection. Point clouds like Pheno4D and Crops3D are, in effect, pre-built collision and shape models for anything that needs to physically navigate around or manipulate a plant. This is agricultural computer vision doing double duty as physical AI training data — perception stacks meant to end up on a machine that moves through the world it’s imaging, not just a model that scores well on a held-out test set. If you’re searching for a robotics dataset for agriculture or a multi-object tracking dataset for farm robots, this is the one built exactly for that.
LettuceMOTS
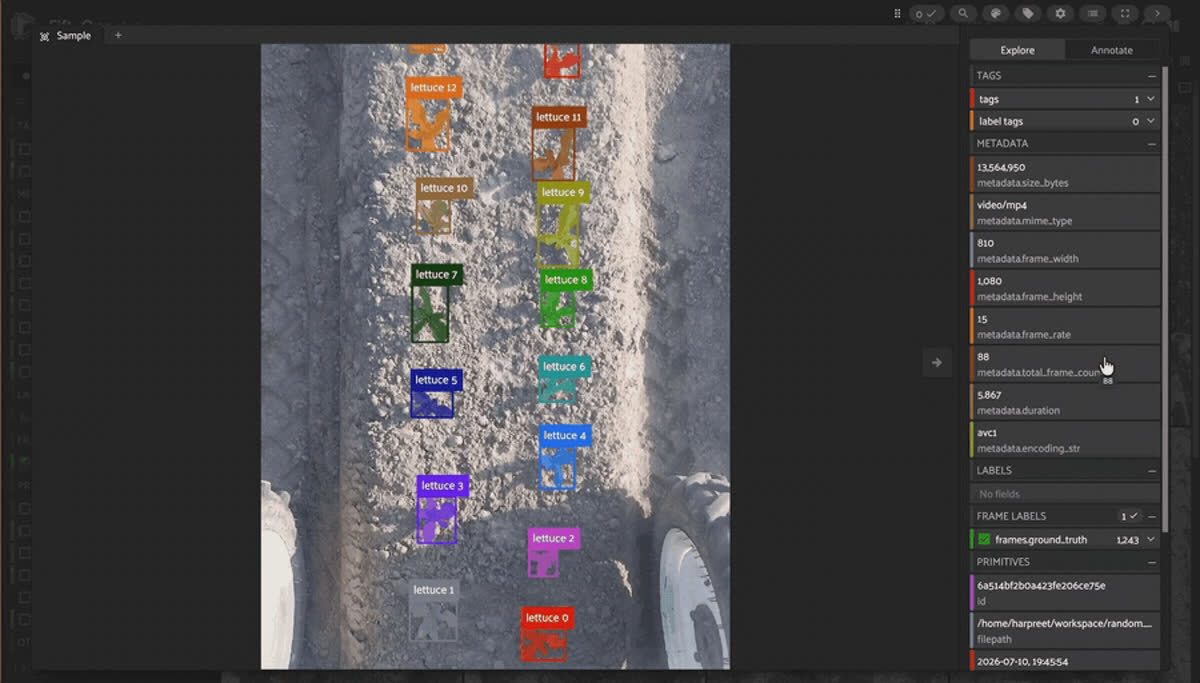
LettuceMOTS robot-captured video frames with tracked lettuce segmentation masks in the FiftyOne app
LettuceMOTS is a robot-captured multi-object tracking and segmentation (MOTS) dataset for lettuce plants, and it’s the one that makes the physical-AI connection explicit. It was captured by VegeBot, a real four-wheel-steer farm robot, as it drove forward and backward and turned in and out of rows on a working lettuce farm — 12 videos, 1,308 frames, 314 tracked plant instances. The task isn’t just segmentation; it’s multi-object tracking under a constraint that no static-camera dataset has to deal with: the robot’s own motion causes lettuce plants to leave the frame and return later, and a precision-spray robot that can’t recognize “I already sprayed this one” will spray it twice. That’s a robotics re-identification problem wearing an agricultural dataset’s clothes, and it’s a preview of where many of the datasets above are headed — from mapping a field to actually driving through one.
Fields. Media type:
video (flat, per-frame labels). Labels: per-frame ground_truth (Detections, with boolean mask and a tracking index attribute unique per plant per sequence). Metadata: sequence, split (train/test), frame_number.Try It Yourself
Every dataset above loads the same way — install FiftyOne once, then pull whichever one you need:
pip install -U fiftyone
import fiftyone as fo
from fiftyone.utils.huggingface import load_from_hub

# swap in any repo from the tables above
dataset = load_from_hub("Voxel51/weeds-galore")
session = fo.launch_app(dataset)

# inspect the schema directly to confirm media type and label fields
print(dataset.media_type)
print(dataset.get_field_schema())- Voxel51 on Hugging Face — all 14 datasets, plus more agriculture and physical AI datasets being added regularly
- FiftyOne on GitHub — the open-source toolkit used to explore, filter, and curate every dataset in this post
- FiftyOne docs — for building your own dataset cards, saved views, and evaluation workflows on top of these
Frequently Asked Questions
What is the best dataset for crop and weed segmentation?
For ground-level RGB with the most species diversity, use
CropAndWeed (100 fine-grained classes, but non-commercial license). For UAV multispectral with the highest instance density, use WeedsGalore. For a hierarchical plant+leaf segmentation task specifically, use PhenoBench. For RGB-D (depth-aware) segmentation, use WE3DS.Is there a dataset for plant growth-stage or BBCH classification?
Yes —
AppleGrowthVision (apples), GrowliFlower (cauliflower), and TomatoMAP (tomato) all tie imagery to the BBCH phenological scale, from bud development through fruit maturity.What dataset should I use for plant disease image classification?
PlantWild is the one built for this: 30,030 in-the-wild images across 146 disease/healthy classes, with GPT-generated text prompts per class for multimodal/CLIP-style classification. Its license (CC BY-NC-ND) prohibits commercial use and derivative works, so check the terms first.Is there a 3D point cloud dataset for agriculture or plant phenotyping?
Yes, three:
Pheno4D tracks the same maize and tomato plants daily over weeks, with per-leaf instance labels — use it for growth tracking and non-rigid registration. Crops3D covers 8 different crop species at a single point in time each — use it for cross-species 3D classification/segmentation. VineLiDAR is unlabeled vineyard terrain and canopy geometry from UAV LiDAR — use it for reconstruction, digital twins, or as a real-world validation target for satellite-derived models.Which dataset provides satellite imagery of agricultural field boundaries?
Fields of the World — 70,484 Sentinel-2 chips across 25 countries with binary, 3-class, and instance segmentation of field boundaries. It’s the largest field-boundary benchmark in this list by a wide margin.Which of these datasets use FiftyOne’s grouped-dataset format?
Four:
AppleGrowthVision (left/right/image slices), GrowliFlower (pre/post slices), TomatoMAP (pos_1-pos_4/macro slices), and Fields of the World (window_a/window_b slices). Everything else is a flat, non-grouped dataset — one sample per image, video, or point cloud.Are any of these datasets model predictions rather than human-labelled ground truth?
No — every label field described above (
ground_truth, ground_truth_semantic, ground_truth_plants, etc.) across all 14 datasets is either manually annotated or manually verified after AI-assisted pre-labelling (e.g. AppleGrowthVision‘s YOLOv8-assisted boxes, WeedsGalore’s SAM-assisted masks). AgroMind’s QA answers are derived from the source datasets’ own expert annotations, not model outputs.Which of these datasets are safe to use commercially?
Check per dataset:
CropAndWeed is explicitly non-commercial only, PlantWild is CC BY-NC-ND (no commercial use, no derivatives), GrowliFlower and Pheno4D don’t state a license at all (contact the original authors before commercial use), and Fields of the World inherits a different license per country tile. The rest (WeedsGalore, PhenoBench, WE3DS, AppleGrowthVision, TomatoMAP, Crops3D, VineLiDAR, AgroMind, LettuceMOTS) are CC BY or CC BY-SA 4.0.Is there a dataset built specifically for agricultural robots, not just cameras?
Yes —
LettuceMOTS was captured by VegeBot, a real farm robot, and its index field on every Detection tracks individual lettuce plants across the robot’s back-and-forth motion, including full disappearance and reoccurrence, which is the re-identification problem a precision-spray robot actually has to solve. If you'd like to learn more, explore our computer vision datasets for agriculture events.Hacker-in-Residence
Harpreet is Hacker-in-Residence at Voxel51, where he turns cutting-edge AI ideas into open-source prototypes and demos that push the boundaries of deep learning. From building tools that inspire to creating content that educates, Harpreet helps the AI community level up—one wild idea at a time.
See all articles by Harpreet Sahota
Try Voxel51 for yourself
Loading related posts...
© 2026 Voxel51 All Rights Reserved