Using Aggregations
Datasets are the core data structure in FiftyOne,
allowing you to represent your raw data, labels, and associated metadata. When
you query and manipulate a Dataset object using
dataset views, a DatasetView object is returned, which
represents a filtered view into a subset of the underlying dataset’s contents.
Complementary to this data model, one is often interested in computing
aggregate statistics about datasets, such as label counts, distributions, and
ranges, where each Sample is reduced to a single quantity in the aggregate
results.
The fiftyone.core.aggregations module offers a declarative and
highly-efficient approach to computing summary statistics about your datasets
and views.
Overview
All builtin aggregations are subclasses of the Aggregation class, each
encapsulating the computation of a different statistic about your data.
Aggregations are conveniently exposed as methods on all Dataset and
DatasetView objects:
1 2 3 4 5 6 7 | import fiftyone.zoo as foz dataset = foz.load_zoo_dataset("quickstart") # List available aggregations print(dataset.list_aggregations()) # ['bounds', 'count', 'count_values', 'distinct', ..., 'sum'] |
Think of aggregations as more efficient, concise alternatives to writing explicit loops over your dataset to compute a statistic:
1 2 3 4 5 6 7 8 9 10 11 | from collections import defaultdict # Compute label histogram manually manual_counts = defaultdict(int) for sample in dataset: for detection in sample.ground_truth.detections: manual_counts[detection.label] += 1 # Compute via aggregation counts = dataset.count_values("ground_truth.detections.label") print(counts) # same as `manual_counts` above |
You can even aggregate on expressions that transform the data in arbitrarily complex ways:
1 2 3 4 5 6 7 8 9 10 | from fiftyone import ViewField as F # Expression that computes the number of predicted objects num_objects = F("predictions.detections").length() # The `(min, max)` number of predictions per sample print(dataset.bounds(num_objects)) # The average number of predictions per sample print(dataset.mean(num_objects)) |
The sections below discuss the available aggregations in more detail. You can
also refer to the fiftyone.core.aggregations module documentation for
detailed examples of using each aggregation.
Note
All aggregations can operate on embedded sample fields using the
embedded.field.name syntax.
Aggregation fields can also include array fields. Most array fields are
automatically unwound, but you can always manually unwind an array using
the embedded.array[].field syntax. See
this section for more details.
Compute bounds
You can use the
bounds()
aggregation to compute the [min, max] range of a numeric field of a
dataset:
1 2 3 4 5 6 7 8 9 10 11 12 13 | import fiftyone.zoo as foz dataset = foz.load_zoo_dataset("quickstart") # Compute the bounds of the `uniqueness` field bounds = dataset.bounds("uniqueness") print(bounds) # (0.15001302256126986, 1.0) # Compute the bounds of the detection confidences in the `predictions` field bounds = dataset.bounds("predictions.detections.confidence") print(bounds) # (0.05003104358911514, 0.9999035596847534) |
Count items
You can use the
count() aggregation
to compute the number of non-None field values in a collection:
1 2 3 4 5 6 7 8 9 10 11 12 13 14 15 16 17 18 | import fiftyone.zoo as foz dataset = foz.load_zoo_dataset("quickstart") # Compute the number of samples in the dataset count = dataset.count() print(count) # 200 # Compute the number of samples with `predictions` count = dataset.count("predictions") print(count) # 200 # Compute the number of detections in the `ground_truth` field count = dataset.count("predictions.detections") print(count) # 5620 |
Count values
You can use the
count_values()
aggregation to compute the occurrences of field values in a collection:
1 2 3 4 5 6 7 8 9 10 11 12 13 | import fiftyone.zoo as foz dataset = foz.load_zoo_dataset("quickstart") # Compute the number of samples in the dataset counts = dataset.count_values("tags") print(counts) # {'validation': 200} # Compute a histogram of the predicted labels in the `predictions` field counts = dataset.count_values("predictions.detections.label") print(counts) # {'bicycle': 13, 'hot dog': 8, ..., 'skis': 52} |
Distinct values
You can use the
distinct()
aggregation to compute the distinct values of a field in a collection:
1 2 3 4 5 6 7 8 9 10 11 12 13 | import fiftyone.zoo as foz dataset = foz.load_zoo_dataset("quickstart") # Get the distinct tags on the dataset values = dataset.distinct("tags") print(values) # ['validation'] # Get the distinct labels in the `predictions` field values = dataset.distinct("predictions.detections.label") print(values) # ['airplane', 'apple', 'backpack', ..., 'wine glass', 'zebra'] |
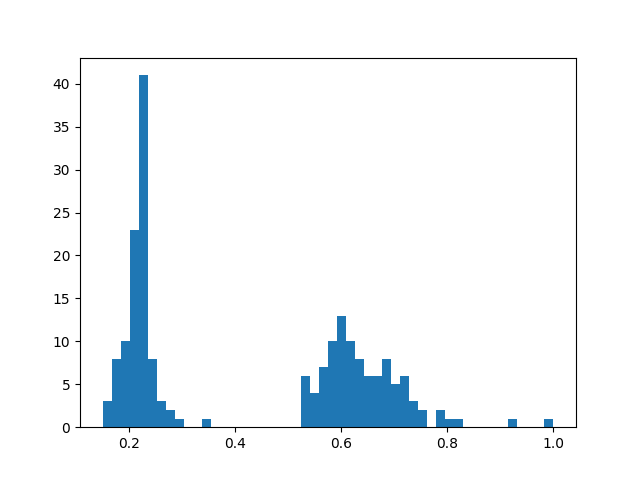
Histogram values
You can use the
histogram_values()
aggregation to compute the histograms of numeric fields of a collection:
1 2 3 4 5 6 7 8 9 10 11 12 13 14 15 16 17 18 19 20 21 22 | import numpy as np import matplotlib.pyplot as plt import fiftyone.zoo as foz def plot_hist(counts, edges): counts = np.asarray(counts) edges = np.asarray(edges) left_edges = edges[:-1] widths = edges[1:] - edges[:-1] plt.bar(left_edges, counts, width=widths, align="edge") dataset = foz.load_zoo_dataset("quickstart") # # Compute a histogram of the `uniqueness` field # counts, edges, other = dataset.histogram_values("uniqueness", bins=50) plot_hist(counts, edges) plt.show(block=False) |
Schema
You can use the
schema()
aggregation to extract the names and types of the attributes of a specified
embedded document field across all samples in a collection.
Schema aggregations are useful for detecting the presence and types of
dynamic attributes of Label fields across a
collection.
1 2 3 4 5 6 7 | import fiftyone.zoo as foz dataset = foz.load_zoo_dataset("quickstart") # Extract the names and types of all dynamic attributes on the # `ground_truth` detections print(dataset.schema("ground_truth.detections", dynamic_only=True)) |
{
    'area': <fiftyone.core.fields.FloatField object at 0x7fc94015fb50>,
    'iscrowd': <fiftyone.core.fields.FloatField object at 0x7fc964869fd0>,
}
You can also use the
list_schema()
aggregation to extract the value type(s) in a list field across all samples in
a collection:
1 2 3 4 5 6 7 8 9 10 11 12 13 14 15 16 17 18 19 20 21 22 23 24 25 26 27 28 29 30 31 32 33 34 35 36 37 38 39 40 41 42 43 44 45 46 47 48 49 50 51 52 53 54 55 56 57 58 59 60 61 62 63 64 65 66 67 | from datetime import datetime import fiftyone as fo dataset = fo.Dataset() sample1 = fo.Sample( filepath="image1.png", ground_truth=fo.Classification( label="cat", info=[ fo.DynamicEmbeddedDocument( task="initial_annotation", author="Alice", timestamp=datetime(1970, 1, 1), notes=["foo", "bar"], ), fo.DynamicEmbeddedDocument( task="editing_pass", author="Bob", timestamp=datetime.utcnow(), ), ], ), ) sample2 = fo.Sample( filepath="image2.png", ground_truth=fo.Classification( label="dog", info=[ fo.DynamicEmbeddedDocument( task="initial_annotation", author="Bob", timestamp=datetime(2018, 10, 18), notes=["spam", "eggs"], ), ], ), ) dataset.add_samples([sample1, sample2]) # Determine that `ground_truth.info` contains embedded documents print(dataset.list_schema("ground_truth.info")) # fo.EmbeddedDocumentField # Determine the fields of the embedded documents in the list print(dataset.schema("ground_truth.info[]")) # {'task': StringField, ..., 'notes': ListField} # Determine the type of the values in the nested `notes` list field # Since `ground_truth.info` is not yet declared on the dataset's schema, we # must manually include `[]` to unwind the info lists print(dataset.list_schema("ground_truth.info[].notes")) # fo.StringField # Declare the `ground_truth.info` field dataset.add_sample_field( "ground_truth.info", fo.ListField, subfield=fo.EmbeddedDocumentField, embedded_doc_type=fo.DynamicEmbeddedDocument, ) # Now we can inspect the nested `notes` field without unwinding print(dataset.list_schema("ground_truth.info.notes")) # fo.StringField |
Note
Schema aggregations are used internally by
get_dynamic_field_schema()
to impute the types of undeclared lists and embedded documents in a
dataset.
Sum values
You can use the
sum() aggregation to
compute the sum of the (non-None) values of a field in a collection:
1 2 3 4 5 6 7 8 9 10 | import fiftyone.zoo as foz dataset = foz.load_zoo_dataset("quickstart") # Compute average confidence of detections in the `predictions` field print( dataset.sum("predictions.detections.confidence") / dataset.count("predictions.detections.confidence") ) # 0.34994137249820706 |
Mean values
You can use the
mean() aggregation to
compute the arithmetic mean of the (non-None) values of a field in a
collection:
1 2 3 4 5 6 7 | import fiftyone.zoo as foz dataset = foz.load_zoo_dataset("quickstart") # Compute average confidence of detections in the `predictions` field print(dataset.mean("predictions.detections.confidence")) # 0.34994137249820706 |
Quantiles
You can use the
quantiles()
aggregation to compute the quantile(s) of the (non-None) values of a field
in a collection:
1 2 3 4 5 6 7 8 9 10 11 12 13 14 15 | import fiftyone.zoo as foz dataset = foz.load_zoo_dataset("quickstart") # Compute quantiles of the `uniqueness` field print(dataset.quantiles("uniqueness", [0.25, 0.5, 0.75, 0.9])) # [0.22027, 0.33771, 0.62554, 0.69488] # Compute quantiles of detection confidence in the `predictions` field quantiles = dataset.quantiles( "predictions.detections.confidence", [0.25, 0.5, 0.75, 0.9], ) print(quantiles) # [0.09231, 0.20251, 0.56273, 0.94354] |
Standard deviation
You can use the
std() aggregation to
compute the standard deviation of the (non-None) values of a field in a
collection:
1 2 3 4 5 6 7 8 | import fiftyone.zoo as foz dataset = foz.load_zoo_dataset("quickstart") # Compute standard deviation of the confidence of detections in the # `predictions` field print(dataset.std("predictions.detections.confidence")) # 0.3184061813934825 |
Values
You can use the
values()
aggregation to extract a list containing the values of a field across all
samples in a collection:
1 2 3 4 5 6 7 8 9 10 11 12 | import fiftyone.zoo as foz dataset = foz.load_zoo_dataset("quickstart") # Extract the `uniqueness` values for all samples uniqueness = dataset.values("uniqueness") print(len(uniqueness)) # 200 # Extract the labels for all predictions labels = dataset.values("predictions.detections.label") print(len(labels)) # 200 print(labels[0]) # ['bird', ..., 'bear', 'sheep'] |
Note
Unlike other aggregations,
values() does
not automatically unwind list fields, which ensures that the returned
values match the potentially-nested structure of the documents.
You can opt-in to unwinding specific list fields using the []
syntax, or you can pass the optional unwind=True parameter to unwind
all supported list fields. See Aggregating list fields for more
information.
Advanced usage
Aggregating list fields
Aggregations that operate on scalar fields can also be applied to the elements
of list fields by appending [] to the list component of the field path.
The example below demonstrates this capability:
1 2 3 4 5 6 7 8 9 10 11 12 13 14 15 16 17 18 19 20 21 22 23 24 25 26 27 28 29 30 31 32 33 34 35 36 37 38 39 40 41 | import fiftyone as fo dataset = fo.Dataset() dataset.add_samples( [ fo.Sample( filepath="/path/to/image1.png", keypoints=fo.Keypoint(points=[(0, 0), (1, 1)]), classes=fo.Classification( label="cat", confidence=0.9, friends=["dog", "squirrel"] ), ), fo.Sample( filepath="/path/to/image2.png", keypoints=fo.Keypoint(points=[(0, 0), (0.5, 0.5), (1, 1)]), classes=fo.Classification( label="dog", confidence=0.8, friends=["rabbit", "squirrel"], ), ), ] ) # # Count the number of keypoints in the dataset # # The `points` list attribute is declared on the `Keypoint` class, so it is # automatically unwound # count = dataset.count("keypoints.points") print(count) # 5 # # Compute the values in the `friends` field of the predictions # # The `friends` list attribute is a dynamic custom attribute, so we must # explicitly request that it be unwound # counts = dataset.count_values("classes.friends[]") print(counts) # {'dog': 1, 'squirrel': 2, 'rabbit': 1} |
Note
FiftyOne will automatically unwind all array fields that are defined in the
dataset’s schema without requiring you to explicitly specify this via the
[] syntax. This includes the following cases:
Top-level list fields: When you write an aggregation that refers to a
top-level list field of a dataset; i.e., list_field is automatically
coerced to list_field[], if necessary.
Frame fields: When you write an aggregation that refers to a
frame-level field of a video dataset; i.e.,
frames.classification.label is automatically coerced to
frames[].classification.label if necessary.
Embedded list fields: When you write an aggregation that refers to a
list attribute that is declared on a Sample, Frame, or Label class,
such as the
Classification.tags,
Detections.detections,
or Keypoint.points
attributes; i.e., ground_truth.detections.label is automatically
coerced to ground_truth.detections[].label, if necessary.
Aggregating expressions
Aggregations also support performing more complex computations on fields via
the optional expr argument,
which is supported by all aggregations and allows you to specify a
ViewExpression defining an arbitrary transformation of the field you’re
operating on prior to aggregating.
The following examples demonstrate the power of aggregating with expressions:
The code sample below computes some statistics about the number of predicted objects in a dataset:
1 2 3 4 5 6 7 8 9 10 11 12 13 14 15 16 17 18 | import fiftyone as fo import fiftyone.zoo as foz from fiftyone import ViewField as F dataset = foz.load_zoo_dataset("quickstart") # Expression that computes the number of predicted objects num_objects = F("predictions.detections").length() # The `(min, max)` number of predictions per sample print(dataset.bounds(num_objects)) # The average number of predictions per sample print(dataset.mean(num_objects)) # Two equivalent ways of computing the total number of predictions print(dataset.sum(num_objects)) print(dataset.count("predictions.detections")) |
The code sample below computes some statistics about predicted object labels after doing some normalization:
1 2 3 4 5 6 7 8 9 10 11 12 13 14 15 16 17 18 19 | import fiftyone as fo import fiftyone.zoo as foz from fiftyone import ViewField as F dataset = foz.load_zoo_dataset("quickstart") ANIMALS = [ "bear", "bird", "cat", "cow", "dog", "elephant", "giraffe", "horse", "sheep", "zebra" ] # Expression that replaces all animal labels with "animal" and then # capitalizes all labels normed_labels = F("predictions.detections.label").map_values( {a: "animal" for a in ANIMALS} ).upper() # A histogram of normalized predicted labels print(dataset.count_values(normed_labels)) |
The code sample below computes some statistics about the sizes of ground truth and predicted bounding boxes in a dataset, in pixels:
1 2 3 4 5 6 7 8 9 10 11 12 13 14 15 16 17 18 19 | import fiftyone as fo import fiftyone.zoo as foz from fiftyone import ViewField as F dataset = foz.load_zoo_dataset("quickstart") dataset.compute_metadata() # Expression that computes the area of a bounding box, in pixels # Bboxes are in [top-left-x, top-left-y, width, height] format bbox_width = F("bounding_box")[2] * F("$metadata.width") bbox_height = F("bounding_box")[3] * F("$metadata.height") bbox_area = bbox_width * bbox_height # Expression that computes the area of ground truth bboxes gt_areas = F("ground_truth.detections[]").apply(bbox_area) # Compute (min, max, mean) of ground truth bounding boxes print(dataset.bounds(gt_areas)) print(dataset.mean(gt_areas)) |
Note
When aggregating expressions, field names may contain list fields, and such field paths are handled as explained above.
However, there is one important exception when expressions are involved:
fields paths that end in array fields are not automatically unwound,
you must specify that they should be unwound by appending []. This
change in default behavior allows for the possibility that the
ViewExpression you provide is intended to operate on the array as a
whole.
import fiftyone as fo
import fiftyone.zoo as foz
from fiftyone import ViewField as F

dataset = foz.load_zoo_dataset("quickstart")

# Counts the number of predicted objects
# Here, `predictions.detections` is treated as `predictions.detections[]`
print(dataset.count("predictions.detections"))

# Counts the number of predicted objects with confidence > 0.9
# Here, `predictions.detections` is not automatically unwound
num_preds = F("predictions.detections").filter(F("confidence") > 0.9).length()
print(dataset.sum(num_preds))

# Computes the (min, max) bounding box area in normalized coordinates
# Here we must manually specify that we want to unwind terminal list field
# `predictions.detections` by appending `[]`
bbox_area = F("bounding_box")[2] * F("bounding_box")[3]
print(dataset.bounds(F("ground_truth.detections[]").apply(bbox_area)))
Batching aggregations
Rather than computing a single aggregation by invoking methods on a Dataset
or DatasetView object, you can also instantiate an Aggregation object
directly. In this case, the aggregation is not tied to any dataset or view,
only to the parameters such as field name that define it.
1 2 3 4 5 6 7 8 9 10 | import fiftyone as fo # will count the number of samples in a dataset sample_count = fo.Count() # will count the labels in a `ground_truth` detections field count_values = fo.CountValues("ground_truth.detections.label") # will compute a histogram of the `uniqueness` field histogram_values = fo.HistogramValues("uniqueness", bins=50) |
Instantiating aggregations in this way allows you to execute multiple
aggregations on a dataset or view efficiently in a batch via
aggregate():
1 2 3 4 5 6 7 8 9 10 11 12 13 14 15 16 17 | import fiftyone.zoo as foz dataset = foz.load_zoo_dataset("quickstart") results = dataset.aggregate([sample_count, count_values, histogram_values]) print(results[0]) # 200 print(results[1]) # {'bowl': 15, 'scissors': 1, 'cup': 21, ..., 'vase': 1, 'sports ball': 3} print(results[2][0]) # counts # [0, 0, 0, ..., 15, 12, ..., 0, 0] print(results[2][1]) # edges # [0.0, 0.02, 0.04, ..., 0.98, 1.0] |
Transforming data before aggregating
You can use view stages like
map_labels()
in concert with aggregations to efficiently compute statistics on your
datasets.
For example, suppose you would like to compute the histogram of the labels in
a dataset with certain labels grouped into a single category. You can use
map_labels() +
count_values()
to succinctly express this:
1 2 3 4 5 6 7 8 9 10 11 12 13 14 15 16 | import fiftyone as fo import fiftyone.zoo as foz dataset = foz.load_zoo_dataset("quickstart") # Map `cat` and `dog` to `pet` labels_map = {"cat": "pet", "dog": "pet"} counts = ( dataset .map_labels("ground_truth", labels_map) .count_values("ground_truth.detections.label") ) print(counts) # {'toothbrush': 2, 'train': 5, ..., 'pet': 31, ..., 'cow': 22} |
Or, suppose you would like to compute the average confidence of a model’s
predictions, ignoring any values less than 0.5. You can use
filter_labels() +
sum() +
count()
to succinctly express this:
1 2 3 4 5 6 7 8 9 10 11 12 13 14 | import fiftyone as fo import fiftyone.zoo as foz from fiftyone import ViewField as F dataset = foz.load_zoo_dataset("quickstart") avg_conf = ( dataset .filter_labels("predictions", F("confidence") >= 0.5) .mean("predictions.detections.confidence") ) print(avg_conf) # 0.8170506501060617 |
Aggregating frame labels
You can compute aggregations on the frame labels of a video dataset by adding
the frames prefix to the relevant frame field name:
1 2 3 4 5 6 7 8 9 10 11 12 13 14 | import fiftyone as fo import fiftyone.zoo as foz dataset = foz.load_zoo_dataset("quickstart-video") # Count the number of video frames count = dataset.count("frames") print(count) # 1279 # Compute a histogram of per-frame object labels counts = dataset.count_values("frames.detections.detections.label") print(counts) # {'person': 1108, 'vehicle': 7511, 'road sign': 2726} |